
You are using an out of date browser. It may not display this or other websites correctly.
You should upgrade or use an alternative browser.
You should upgrade or use an alternative browser.
What a Great Day for a Butterfly, Check out the ABE Indicator that is coming soon!
- Thread starter Wayne
- Start date
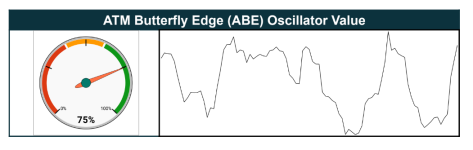

I got the ATM Butterfly Indicator live on the Aeromir site: https://aeromir.com/abe
Let us know what you think of it!
Let us know what you think of it!
It would be good to have at least some info on how it works, what data it uses to calculate the results on the gauge. If not 100% detailed at least some hints. I imagine it was discussed in your latest paid course, probably, in the just finished "butterfly and condor course", as it has a line:
- How to Quantify a Good and Bad Environment - Wayne Klump will teach how to quantify a good and bad environment and possible adaptations to compensate.
Hi all!
It is a tool I use in my butterfly trading.
I map standard Options pricing across all expirations and overlay a vol surface model to come up with my own options pricing model. This tells me if a structure like a butterfly with shorts around the money is advantageous at any given moment.
As for types of trades, here is a list of some that would benefit from entry timing/increasing, or decreasing allocation size utilizing the metric...
Rising and high is best entry time
falling and low is the worst entry time
A14
Rock type SPX
Various X trades from John Locke
Rhino
Road trip
Boxcar
Heart trade
m3u SPX
Basically, anything that uses a butterfly/condor-based structure around the money. This is designed for anything beyond 10DTE for entry.
We released it to everyone for free for a while so that you can see if it applies to your trading. I have seen many people using only volatility to determine entry and they get hammered sometimes due to other factors I take into account. So check it out, if it helps it is super inexpensive for how much money can be saved on one bad trade. If it doesn't move on and I wish you abundance in your trading. =)
It is a tool I use in my butterfly trading.
I map standard Options pricing across all expirations and overlay a vol surface model to come up with my own options pricing model. This tells me if a structure like a butterfly with shorts around the money is advantageous at any given moment.
As for types of trades, here is a list of some that would benefit from entry timing/increasing, or decreasing allocation size utilizing the metric...
Rising and high is best entry time
falling and low is the worst entry time
A14
Rock type SPX
Various X trades from John Locke
Rhino
Road trip
Boxcar
Heart trade
m3u SPX
Basically, anything that uses a butterfly/condor-based structure around the money. This is designed for anything beyond 10DTE for entry.
We released it to everyone for free for a while so that you can see if it applies to your trading. I have seen many people using only volatility to determine entry and they get hammered sometimes due to other factors I take into account. So check it out, if it helps it is super inexpensive for how much money can be saved on one bad trade. If it doesn't move on and I wish you abundance in your trading. =)
From what level ? From red to green or just from light green to dark green ? It changes too fast What may look good one day a few days later it's not looking too good or passed the high and it's going down When it's going down is that time to exit or not necessarilyRising and high is best entry time
Maybe a demo with live data could be useful
Hi Wayne, is the model skew based, so when markets go down, the upside vol strikes get closer to eachother, so lets say, strikes difference of only 0.3% vol difference and when markets go up, the volatility between strikes gets wider, lets say 0.6-0.9% between 10 point strikes?
Wayne, congrats on your new indicator. Hope you will do well with it.
I understand it's propriety and don't ask for any details but I'm interested in how ABE line looks for the historical data.
Can you post a picture of ABE line for, say, past 3 years? That would be ideal but even 1 year would do. Thanks.
I understand it's propriety and don't ask for any details but I'm interested in how ABE line looks for the historical data.
Can you post a picture of ABE line for, say, past 3 years? That would be ideal but even 1 year would do. Thanks.
yes, for nowIs this for SPX only ?
Last edited:
That could be a way. Not what I do though.Hi Wayne, is the model skew based, so when markets go down, the upside vol strikes get closer to eachother, so lets say, strikes difference of only 0.3% vol difference and when markets go up, the volatility between strikes gets wider, lets say 0.6-0.9% between 10 point strikes?
Thanks, Marcas. Absolutely I will post it in a second.Wayne, congrats on your new indicator. Hope you will do well with it.
I understand it's propriety and don't ask for any details but I'm interested in how ABE line looks for the historical data.
Can you post a picture of ABE line for, say, past 3 years? That would be ideal but even 1 year would do. Thanks.
