Option risk calculator on calendars

Michael B

Member
I hope Dan Harvey can comment on this.

After seeing Dan’s video on how to use the Option Risk Calculator, I thought I would give it a try analyzing calendars. I keep having success with very short term calendars on SPX while everybody recommends longer term, so I wanted to see what the calculator thinks about them.

For example sell ATM put 4 DTE / buy ATM put 7 DTE. Basically place the trade on a Monday for Friday / next Monday expiration and close the trade after 1-3 days or more if it’s a longer term calendar.

I used real option prices I captured this morning (9 Nov) roughly one hour after opening.

SPX was 3610.

Here are some screen shots with various terms.

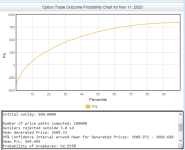
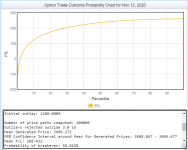
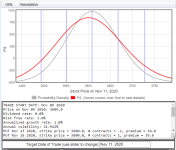
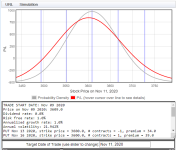
This is probably the best among various combinations I tried and I’m even using less favorable fills (sell at bid / buy at ask).

13 Nov / 16 Nov
1604947266575.png

1604946902845.png

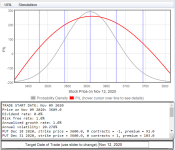
A longer term is not too bad, but initial debit is much higher.

18 Dec / 31 Dec
1604947035746.png

1604947050871.png

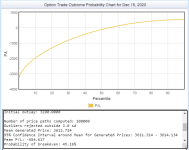
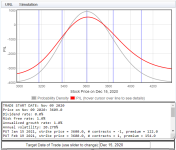
Then the 2 month / 1 month DTE is not enticing at all with 3600 initial debit. Closing one month before expiration shows P/L as a loss. Trying to close early has 0% probability to break even.

15 Jan / 19 Feb
1604947069275.png

1604947079785.png

So I’m not sure what to learn from this. Those short term ones look too good to be true.
Looking forward to any feedback.
Thank you!
 

Attachments

  • 1604946883536.png
    1604946883536.png
    45.5 KB · Views: 4
You may not have asked the simulator to "run the full trade" which takes into account the back leg. When you choose that option instead of simply running the simulation on the front leg, you will have to answer a few questions about STOPs at certain P/L or STOPs at x% in-the-money, etc. When I ran it with your details and answered the questions conservatively, I received a result with a negative mean P/L (expected return) and a flat probability curve centered around zero. Those results fit with my experience and expectations. It may be that you are successful with this short-term approach. If so, I commend you for your success, because I don't think that is the norm...at least not for me or for most people who write about time spreads.
 
With great respect for the contribution given to the forum by the opinion of others, I would like to warn about using the statistical method when it comes to Options trades.
Some of the most frequent mistakes (IMHO)
1) exclude or restrict the SD parameter.
2) Volatility is premium..and is always changing before exipy.At expiry is always 0!
3) If a position does not need any adjustment in most cases is directional! (Including those that target 0 movement).
 
Looks like that market moved down a lot so it's outside the tent so you may want to close it or add a tent lower but since the expiration is a few days away it may be better to just close it

I did not use the risk calculator but I am experimenting with something similar
I am using diagonals instead of calendars and place it slightly OTM so that the market is around the crossover of the expiration over the zero line That seems to be the sweet spot for this diagonal
I am using 5 wide for the spread so the bigger risk is to the upside and a much smaller risk to the downside
Also I am placing it 14 to 21 days away but try to take profits in the first week if it's possible this way I don't have to panic and make any adjustments in the first week After the first week there should be some profit if the market did not move too far
If it wasn't for these large moves this could be a good trade most of the time
You could easily make 10% on margin in a couple of days

Another trick I discovered is that if you sell the Friday and buy the Monday (for SPX) it is much cheaper than any other combination
I am not sure why that is but that is what I observed
 
As I have often stated, all Monte Carlo simulations must be taken with a grain of salt, since they represent a scenario based on a static point in time and with the assumption of no adjustments, additions, subtractions, change in volatility, news, etc. Those who have heard my previous discussions on this topic both at Aeromir and another venue may recall that I use the Option Risk Calculator only to determine whether a trade is likely to be profitable on a purely probabilistic basis. In other words, why enter a trade that has little chance of success based solely on probability if no parameters are changed? Would a poker player go all in on the likelihood of drawing to an inside straight?
 
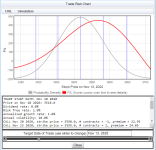
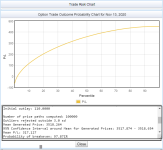
Here is my diagonal
Not sure exactly how to interpret the results
 

Attachments

  • graph.PNG
    graph.PNG
    40.9 KB · Views: 11
  • Simulation.PNG
    Simulation.PNG
    32.2 KB · Views: 11
  • Result.PNG
    Result.PNG
    23.8 KB · Views: 11
For a while I followed Amy Meissner’s boxcar service when it started and noticed she was using calendars for the boxcar trade and they were kind of short term. And they worked. This made me look more into them and after tedious back tests it seemed to me the 4/7 DTE setup has merit.

I still have a full time job, but live on the West coast so I can be in the market during the first hour or so and after that I leave for work. Cannot trade at work. So I usually enter on a Monday morning with short ATM put for Friday/long ATM put for Monday. If order is filled, I place a closing order for $100 profit and leave for work. If the order to enter the trade is not filled, I may re-place the order Tuesday morning. The closing order is occasionally filled within the 1st day, but if not, I may readjust it higher if futures look promising next morning. If SPX starts to go against me and I’m at work, there is nothing I can do, so next morning I accept the loss and close it.

100 / contract may not look like a lot, but the initial debit is around 500, so in terms of ROI it’s not bad for 2-3 days.

I play these on the RUT as well, but the long leg needs to be next Friday and debit is double. They work too.

Like Status1 said, the Friday/Monday expiration combination is cheap and seems to work well. The ATM volatility for Friday expiration is consistently 1.5-2% higher than the one for Monday. Not sure if this is the reason.

Coming back to the risk calculator, I’m far from saying that I would blindly rely on it. I was simply curious how these trades look on the calculator and they look great.
 
Michael B, good work re backing up your trades. I don't trade calendars often but appreciate work you put to look around.
The reason for Fridays' elevated vol is a weekend gap risk. Traders demand higher premium for holding risk for couple days when markets are closed. You may also note that spreads are widening toward Friday's close - same reason. Fills varies, sometimes are harder sometimes not.
As for the Option Risk Calculator. It is a toy. One can play with as a start but it is not suited for any more serious trading research. This is, of course, my opinion only, based on what I want to support my trades on.
 
I am not sure if you want a past trade or new trade
Here are a couple of past trades
As you can see on the Oct 1 trade I paid 45 cents for one diagonal 5 wide so that is $500 risk on the upside
On Oct 2 EOD it was showing $65 gain so that's over 10% in 2 days of course I got a little greedy so I let it run longer and ended up with a loss of $139 on OCT 13 but that was already outside the tent on the upside so I did not want to let it run longer but if I did it would have been profitable as the market came back down and into the tent That was 100 points in 10 days

The other trade which is the best one yet was on Oct 15 which was a down day so I got in with a credit of 25 cents and I was already up 10% by the end of the day I let that one run too and got out on Oct28 which was a down day and near the lower part of the tent but I was able to get out with a good profit of $195 because the Vol spike on that day so that's a nice 38% gain in 10 trading days

So the strategy has a good potential for profit but it's critical to enter and exit at the right time to get good gains or just get out with 10% gain in a couple of days if the market cooperates
Those were placed with the market a little bit inside the lower part of the tent but with these wild gaps I am trying it a little further up to see how that works since it went out of the tent on that Oct 1 trade It's still a work in progress
 

Attachments

  • OCT 1 TRADE.PNG
    OCT 1 TRADE.PNG
    23 KB · Views: 9
  • EOD DATA ON OCT 2.PNG
    EOD DATA ON OCT 2.PNG
    12.4 KB · Views: 9
  • OCT15 TRADE.PNG
    OCT15 TRADE.PNG
    24.7 KB · Views: 5
  • EOD DATA ON OCT 15.PNG
    EOD DATA ON OCT 15.PNG
    12.2 KB · Views: 8
Status1, best would be a trade that would have started today. If it were to place a trade this morning what strike and expiration for each leg? Puts or calls?
 
The reason for Fridays' elevated vol is a weekend gap risk
That is good to know
What would you say is the most optimal time to enter a trade to take advantage of this elevated vol ?
Would it be better to enter it on a Monday or maybe closer to Friday ?
 
best would be a trade that would have started today
Unfortunately I am afraid this may not be a good entry since I placed it Friday for 20/23 Nov expiration
I think I paid a bit much for it 1.10 and I am using the -3570/3575 calls in SPX
That was a scary ride yesterday as it went up to the outside of the tent on the upside but than it pulled back but still higher than where I entered at 3509 Right now it's trading at 1.05 so it's close to where I entered it but at a higher market price
It may still work out if the market stays near this range

I am guessing because the volatility is lower the price for the diagonal is higher or maybe the skew is causing it
In any case the T+0 line of the diagonal seems to be in the sweet spot Normally I would expect it a little lower but I guess it varies
You could try going a little higher if you think the market will go up maybe at -3595/3600 for 1.30
 
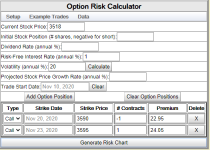
OK, just so I can go through this exercise I will assume you place the highest strike roughly 75 points above spot. This morning I stored option chain data when SPX was 3518.

So I place this trade:

Sell 20 Nov 3590 call at 22.95
Buy 23 Nov 3595 call at 24.05
Debit 1.1

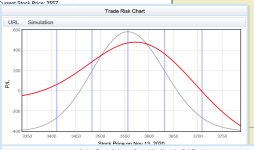
Looks like this in the calculator.

1605064287605.png

1605064356106.png

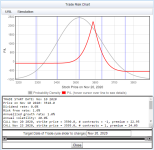
Then adjust the Target Date slider to the day you plan to exit, say Nov 13. The red curve shows a wide profit range and loss is very small on the down side. That's a nice setup.

1605064399556.png

Then click Simulation, choose Run Trade Outcome Simulation for Nov 13 and keep the setting for 3 SD
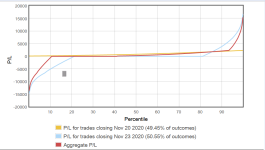
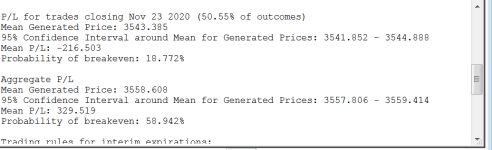
You get this which looks pretty good. If entry variables (strikes, premiums, volatility, days to expiration) stay close the the ones we used, this simulation makes me think I could run this mechanically and it should work as long as SPX doesn't exceed +/- 3 SD. Of course one needs to be prepared to step on the brake if needed.

1605064612509.png

If you want to readjust things, click the Close button and modify data or trade exit date in previous windows as you wish and simulate again.
The trade looks good even if initial debit is double.
 
And here is proof that sometimes luck exists. I opened this calendar this morning and then placed the closing order for around 105 profit per contract. Got filled at the end of the day.
1605066527737.png
 
Thanks Michael B
Just a couple of questions
How critical is the risk free rate and the annual volatility and where do you get them from ? Or are you using the calculate button to calculate the volatility ?
Another question is about what Dan mentioned about running the full trade so that includes both legs of the trade
There is another window that pops up but there is not much that can be entered except the p/l so I am assuming that the simulation in this case will run up to the expiration
How do you interpret the results for the full trade simulation ?
 
The free rate I guess is the interest rate and I set to 1% per Dan's video in which he explained the calculator. You can simply change it and see the impact.
For volatility I tried either the volatility for the strike I am using or use the calculate button. If vol change is not much, the impact shouldn't be significant. And like others said, this is not exact science, the way I look at it is I want to simply make sure I don't enter a trade that's predicted to fail.
Never looked at the full trade results because I would never keep the trade that long.

However I need to mention I have never started a calendar based on the calculator. I just started to look at them using the calculator few days ago.

I hope to have more time tonight to run few comparative trades where I vary DTE.
 
I suggest that individuals interested in applying the concepts employed by a Monte Carlo simulation program such as Option Risk Calculator study the documentation for strategies having legs with different expirations, such as calendars and diagonals. Unless the "volatility stars" align for both legs within a very short time window, most of these trades will fail, break even, or have an inconsequential profit. While it is possible to occasionally have a good win with a short term time spread, a positive expected return after multiple (hundreds or thousands) of trades is unlikely. Monte Carlo simulations are designed to estimate expectancy over many trades even though a few winners (as well as big losers) will inevitably occur. That's why most experienced traders choose a longer time horizon. This was discussed in Tasty Trade sessions and elsewhere. For traders who have back testing capability, I suggest testing 50 or more short term time spreads and posting the results to an expected return spreadsheet in order to determine whether or not to use this strategy. Personally, I only trade strategies in which I can unequivocally demonstrate positive expectancy with relative ease and simplicity. For example, it is often possible to make a butterfly (any kind) "work" after hitting it over the head with many adjustments and added capital, but I prefer simple trades which usually work out by themselves with few or no adjustments. Finally, the interest free rate is currently closer to 0.1% than 1%.
 
What would you say is the most optimal time to enter a trade to take advantage of this elevated vol ?
Would it be better to enter it on a Monday or maybe closer to Friday ?
Those are good questions status1. I do not have answers for you though, as I did not spent time on this.

Here is how I'd start if I was more interested.
First determine what you want to research, and do it with reasonable precision. Let;s say you want to look into smth called 'Friday vol expansion'.
Then verify that Fve is a real thing and not just an urban legend.
After that, find what strikes are involved. What expirations are involved. How long this Fve lasts, when it starts, when it has culmination.
Based on that you can start designing some trades exploiting Fve.

It is highly probable that Fve does not exist for the sole reason to give you an edge. If so, you should find where the risk hides and what is the optimal way to hedge that risk (optimal for you, rather do not seek the best way to hedge).

You may find out that Michel B and other traders are successful trading short therm calendars not because of Fve but despite of it and that there is some other factor (edge) involved.

You can go on and, if you like what you see, fit this trade into the whole system or wrap it in a nice easy to follow guidance and place it in your toolbox.

I mentioned before that I do not pay as much attention to IV as I did in the past, but as I remember BSM starts to behave erratically when you get closer and closer to expiration, so probably some special handling of data is needed to get reasonable results.

Wherever you successfully develop a trade or not you will end up with more knowledge and your confidence level will increase. You won't follow blindly trading anything around Fve and be more immune to BS that surely will find a way to reach your ears during your trading career.
 
Thanks Marcas,
I thought maybe you or someone else had more knowledge about this Friday's elevated vol and did some research on it
I just happened to stumble on it as I was trying different expirations for calendars and diagonals mainly looking to buy it as cheap as possible which may or may not be a good thing
As far as the strikes it makes no difference
As far as I know this only applies to SPX since it has Monday expirations and I am not aware of any other index or stock that has Mondays expiration
 
Top
Contact Us