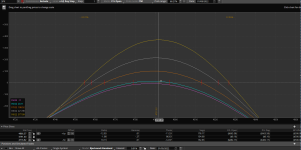
I would not call Theta "trashy" and the problem is not with long term and short term impact it's just with the assumption that everything else staying the same Theta should decay at a certain rate and it used to work fine in the past on TOS but something has changed recently and it no longer functions as it should
Usually I don't cal theta 'trashy'. It is just n innocent number like any other in realms of mathematical model. What matter is we do with it.
What I wanted to say is that (imo, as always) that if one keeps relaying on theta in his trading he sets himself up for a disappointment.
What you said in your reply is basically the same / v.similar to my description. Value of theta will fluctuate a lot with small changes of IV or price moves, so any value it has at any given moment does not matter much and if you relay on it in your trading decisions it eventually will bite you.
Have a question for you: how does theta decay should look like to make you satisfied?
Anything that t+n line tells is just an estimation. T-line drawing can meet your expectations - then you are happy or not - which can make you upset.
Market conditions may be such that what 'bugged' TOS platform says will prove to be spot on.
That is absolutely not true
I suppose you refer to my last sentence (correct me if I'm wrong).
If you agree that theta is just an estimation (is a guess) then there is no 'correct' theta value.
There is a probability that any given theta will occur accurate some day. In your perception it may be very unlikely but if all values that were used in TOS' (any) calculation match the live values (another topic) result will be the same as in t+n prediction.
If I have a calendar trade that I just placed and it shows I will make $500 the next day with everything else staying the same I am sure that will not happen in reality
That's why I called theta 'trashy' number, practically meaningless for trading purposes (take this with a grain of salt, I'm not suggesting to remove theta from trading platforms) .
I also want to point out that you used words 'absolutely' and 'sure' when talking about trading. This is dangerous state of mind for a trader - as usual: imo.
I don't want to open calendars. This is where things related to theta are exaggerated and theta is exceptionally 'trashy'. If you get your mind around theta in single options and spreads it will be easier with calendar spreads/time spreads.
Marcas said:
Try to read DaveN's post again. There is an answer for your dilemmas there.
I did not see an answer there He probably is not even using TOS
He is talking about in general terms assuming that the model is just a little off overall not specifically about the Theta and p/l correlation
This is more specific to TOS so if you are not using TOS and are not looking at the greeks and p/l then everything is fine
He did answer. Likely not as you expected though, but it is a good answer. He focused on real issue not on a detail of lesser importance.
But if you are not interested in how to approach the issue from trader's perspective but rather from math/modeling side, then, true, there is no answer for your question there.
Marcas said:
Actually I look only at t+0 with huge 'handle bar' correction in mind
In this case it's more like half the handle bar missing
This is absolutely not true and I'm sure about it.

Yes, these are models and there are limitations, but when you look at these day steps you know something is broken in the model. I'm not looking for accuracy here, not even 10%, but to show next day P/L roughly 4 times smaller than Theta predicts is too much.
Mike, there is a joke I like:
Two ladies are taking:
- Did you hear that in Home Depot dozen eggs cost 10 cents?
- No, I didn't. It can't be true!
- No it can not... But how cheap it is!!
If you know (and understand) limitations of models then you should have no problems with t-lines. Then you understand why the lines look like they do and what it tells about the modeling method they use.
If TOS (in this case but it applies to all: IB, Tastyworks, Robinhood, ONE... all of them) fix shape of t-lines to your liking they break something else and have complains from other users whos likings were violated.
Those lines are only estimates. They may show you in which regions theta has bigger values, they may show you roughly how your delta looks like etc. but don't expect any 'sure thing' from them. With an exception of expiration graphs (don't forget commissions and other friction costs).
In TOS you can choose from couple of methods of calculating the lines. Learn about them, choose the one you like and stick with it, but all of them are touched by the same blemish (some are typically more often used for specific purposes than others but all need a 'handlebar handling').
Solution for your problem that many traders use (imo) is switching to platform that do calculations the way they are comfortable with (or do their own calcs). If you can not work with TOS' t-lines, try this way. I do not expect TOS to change calculations with every complain they have.
In your example t-lines being lower that theta says they should be is, likely, a result of using some sort of IV modifications. Means: TOS predicts increase in IV thus t-line positions differs 'more than 10%' from what theta predicts. Theta is not the number you should be worry about.


 )
)