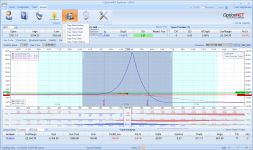
I was trying to look at my past losing trades and trying to use ONE to see if where could I have made an adjustment to fix the trade but I ran into a glitch or bad data
This was on a diagonal placed on Jan 29 sometime during the day in reality but I placed the trade in ONE at 15:55 Than I advanced the day by one I saw a huge gain Over +14% in one day when in reality it was a loss at EOD Than I advance it another day and now it's down -60% and while it was down in reality it was only -7%
Advancing another day is down only -15% while in reality it's only -2.7%
So I thought maybe Tos had some bad data and switched to IBKR data and it was the same so not sure what to make of that
Than I started looking at the data more closely and I saw some big change in the 5 minute time in ONE
So I set up the same trade at 15:50 instead of 15:55 on the same date with the same expiration and strikes So then I advanced it by 5 minutes and it was down -19% while advancing the date to 15:55 the next day the loss is at -14% but than advancing it just 5 minutes more now it shows a +14% gain
So bottom line is you can't rely on the data 100% You have to be careful where you place the data because 5 minutes one way or the other can affect the trade by a lot Maybe you should not even look at or place any trades 5 minutes before the close
I hope the rest of the data is ok otherwise the back trader in ONE will quickly become useless and unreliable
This was on a diagonal placed on Jan 29 sometime during the day in reality but I placed the trade in ONE at 15:55 Than I advanced the day by one I saw a huge gain Over +14% in one day when in reality it was a loss at EOD Than I advance it another day and now it's down -60% and while it was down in reality it was only -7%
Advancing another day is down only -15% while in reality it's only -2.7%
So I thought maybe Tos had some bad data and switched to IBKR data and it was the same so not sure what to make of that
Than I started looking at the data more closely and I saw some big change in the 5 minute time in ONE
So I set up the same trade at 15:50 instead of 15:55 on the same date with the same expiration and strikes So then I advanced it by 5 minutes and it was down -19% while advancing the date to 15:55 the next day the loss is at -14% but than advancing it just 5 minutes more now it shows a +14% gain
So bottom line is you can't rely on the data 100% You have to be careful where you place the data because 5 minutes one way or the other can affect the trade by a lot Maybe you should not even look at or place any trades 5 minutes before the close
I hope the rest of the data is ok otherwise the back trader in ONE will quickly become useless and unreliable
Last edited by a moderator: