
You are using an out of date browser. It may not display this or other websites correctly.
You should upgrade or use an alternative browser.
You should upgrade or use an alternative browser.
Calendar Modeling into Expiration
- Thread starter Ted C
- Start date
I am afraid not
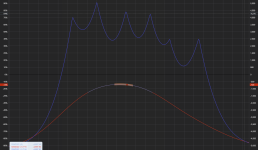
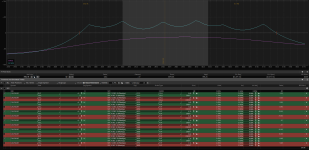
It all depends on the volatility and without it most calendars expiration will go down and possibly end in a loss
The one in the center will win if SPX expires near the top of the tent but all the other calendars around it will drag the entire expiration line down unless there is a spike in volatility
It all depends on the volatility and without it most calendars expiration will go down and possibly end in a loss
The one in the center will win if SPX expires near the top of the tent but all the other calendars around it will drag the entire expiration line down unless there is a spike in volatility
there is a way to model calendars in thinkorswim, but the problem is it won't be very accurate. the best you can hope to do is bound the approximate movement. you can model the volatility of each expiration separately and as you vary the values you'll see the t0 line move up or down depending on which expiration you vary and whether you increase or decrease the value. the expiration curve won't move so you'll have to advance time to see what the t0 will look like at expiration. the question is, how much will volatility of the 2 expiration change? your guesses at that will determine the bounds.
to vary the volatilities in thinkorswim, click on the gear icon on the lower right of the screen, and then click on more parameters. this will bring up a tool that allows you vary the vol for each expiration separately.
to vary the volatilities in thinkorswim, click on the gear icon on the lower right of the screen, and then click on more parameters. this will bring up a tool that allows you vary the vol for each expiration separately.
Thanks status1 and Jim for your replies.
Very interesting day. The 3960 peak dropped from 5K to about $800 and as a whole the trade would have ended up losing with the late drop.
However, I started closing the outside cals right at the open and was out of everything 45 min into the day for a 9.54% profit.
Very interesting day. The 3960 peak dropped from 5K to about $800 and as a whole the trade would have ended up losing with the late drop.
However, I started closing the outside cals right at the open and was out of everything 45 min into the day for a 9.54% profit.

DaveN
Member
@Ted C , another way to think of Calendars is around that spread between your front contract and back contract. A lot of how Calendars behave is determined by that amount of horizontal (across time or expirations instead of vertical, or strikes in the same expiration) span. Think about how Volatility is affecting each of the contracts in your Calendar.
This week is a great example of how higher IV doesn't always help a Calendar. It looks like your trade is made up of 3-day Calendars, or what I call Skinny Cals. I see that your T+ 0 line has dropped even though IV has risen. I've seen this in both my Butterflies *AND* Calendars this past week.
How can that be???? Calendars are positive Vega trades, meaning an increase in IV should increase the value of the Calendar. ToS, ONE, OV, and all option software will model this in the same way.
I generally trade 7 or 5-day Calendars, not 3's but the same rationale would apply to each. Right now, the market is holding all kinds of Premium in option contracts in anticipation of CPI and FOMC, next Tues and Wed. High premium means those short options in your front expiration on the Calendar have not only held on to their value, but possibly increased in value depending on when you entered them. That would be fine, and the models assume that an increase in IV takes place across all expirations. When the market is in Contango, meaning the further out in time you go, the higher the uncertainty, and hence the volatility, then the back contract increases even more than your front. And BAM, up goes the price of your Calendar and Expiration Tent, and you are smiling.
Right now, the market is in Backwardation (not Contango) in most horizontal spreads. IV increases are hurting most Calendars. CPI and FOMC are both Binary Events meaning right afterwards, the information is out in the market and it will adjust quickly. Your trades are in 9 Dec and 12 Dec, next Friday and the following Monday, so they are both close to but after the binary events. I'm thinking that option premium will snap back to "normal" a bit on Tuesday after CPI, then Wed after FOMC. IV across all of the near term Expirations should move back to normal, and even though IV drops, I'm expecting my Calendars and Butterflies to both react positively. The models (assuming Contango) will show otherwise for Calendars.
I know this was a long'ish post, and I hope it makes sense. Certainly, I have no idea what will actually happen. These are my theories and my opinion about my own positions in the coming week.
This week is a great example of how higher IV doesn't always help a Calendar. It looks like your trade is made up of 3-day Calendars, or what I call Skinny Cals. I see that your T+ 0 line has dropped even though IV has risen. I've seen this in both my Butterflies *AND* Calendars this past week.
How can that be???? Calendars are positive Vega trades, meaning an increase in IV should increase the value of the Calendar. ToS, ONE, OV, and all option software will model this in the same way.
I generally trade 7 or 5-day Calendars, not 3's but the same rationale would apply to each. Right now, the market is holding all kinds of Premium in option contracts in anticipation of CPI and FOMC, next Tues and Wed. High premium means those short options in your front expiration on the Calendar have not only held on to their value, but possibly increased in value depending on when you entered them. That would be fine, and the models assume that an increase in IV takes place across all expirations. When the market is in Contango, meaning the further out in time you go, the higher the uncertainty, and hence the volatility, then the back contract increases even more than your front. And BAM, up goes the price of your Calendar and Expiration Tent, and you are smiling.
Right now, the market is in Backwardation (not Contango) in most horizontal spreads. IV increases are hurting most Calendars. CPI and FOMC are both Binary Events meaning right afterwards, the information is out in the market and it will adjust quickly. Your trades are in 9 Dec and 12 Dec, next Friday and the following Monday, so they are both close to but after the binary events. I'm thinking that option premium will snap back to "normal" a bit on Tuesday after CPI, then Wed after FOMC. IV across all of the near term Expirations should move back to normal, and even though IV drops, I'm expecting my Calendars and Butterflies to both react positively. The models (assuming Contango) will show otherwise for Calendars.
I know this was a long'ish post, and I hope it makes sense. Certainly, I have no idea what will actually happen. These are my theories and my opinion about my own positions in the coming week.
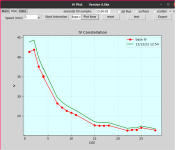
i follow iv during the day. this is the at-the-money spx iv constellation for the next 25 days. i captured this near the close today. the base iv line was captured shortly after the open. the iv was pretty much unchanged today until the market started rising this afternoon. if i remember, i'll capture it tomorrow and wednesday and post a follow-up.
DaveN
Member
Nice @jim leahy! I track something similar. It shows very nicely how IV lifted that whole curve over the day today. Even though we rallied up by 30 points in the latter half of the session, VIX didn't really drop off. This shows clearly in your curve movement. Nice graphic.
what software program do you use to capture this data ?i follow iv during the day. this is the at-the-money spx iv constellation for the next 25 days. i captured this near the close today. the base iv line was captured shortly after the open. the iv was pretty much unchanged today until the market started rising this afternoon. if i remember, i'll capture it tomorrow and wednesday and post a follow-up.
View attachment 4403
this is a python program i wrote, but with a little work there's no reason why you can't duplicate this with excel and rtd data from thinkorswim.what software program do you use to capture this data ?
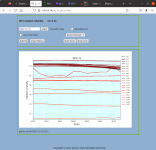
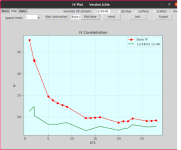
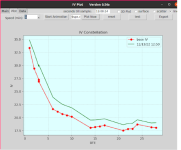
i plotted the spx iv constellation on tuesday and today. the cpi was released tuesday before the market open and wednesday afternoon (eastern time) the fed released the latest interest rate change. it should be no surprise that the iv dropped after a favorable cpi report, yet was still in backwardation ahead of the fed announcement. after the fed announcement, the iv dropped across all expirations and by the end of the day most of the backwardation corrected. the third graph is from a program that is a work in progress (slow progress), and captures the iv across different strikes instead of different expirations. i used today's expiration and centered the graph using the at-the-money strike. this is sort of hard to read, but you can tell the general reaction of the volatility. this was sampled at various times during the day, not at regular intervals, but generally 10 or so minutes apart, starting with the open. the very top trace was sampled about 1 minute before the announcement and the squiggly trace was sampled shortly after the announcement. the last sample was shortly after 3:00, eastern time. i stopped sampling because it would just decline to 0 since it was expiring today.
DaveN
Member
Thanks for sharing @jim leahy! There's a lot of information in your plots, and a lot of potential for visualization from different perspectives.

DaveN
Member
@Marcas, I agree. Typical software will show a static picture of the modeled "now" as well as let you click backwards and forwards to see what a change in time will theoretically produce. You can click Volatility up or down to see the effect, but there are some embedded assumptions such as Contago for Calendar modeling. It's certainly possible to trade with this, and many do trade successfully on this alone.
@jim leahy's Perspectives that he shared are valuable, and look at this from different angles, over time or across Expirations. Those can help to understand and see the bigger picture of why your trade did what it did, or help you develop a more complex, or multidimensional perspective around how to adjust or position a trade.
@jim leahy's Perspectives that he shared are valuable, and look at this from different angles, over time or across Expirations. Those can help to understand and see the bigger picture of why your trade did what it did, or help you develop a more complex, or multidimensional perspective around how to adjust or position a trade.