How to add vertical line to existing chart?

TonyW

New member
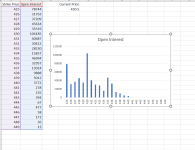
Please take a following attachment, mainly I just have 2 columns, strike price and OI. I used insert recommended chart, the clustered column chart is the one that looks best for me. I just wanted to dynamically add a vertical line to the chart with whatever the current price is (430.5). I tried to follow Mutiple examples online but my chart always look messed up after I try to add the vertical line. Any suggestions or help?


1686771337743.png
 
From what I read online you have to use a combo chart
I don't have that chart type on my excel 2010 so I can't try it out

Another option would be if you have one of Tom's earlier Daytrading spreadsheet and see how the Mark is implemented on the chart

Not sure if you want this to change live with the market or you just want to set it in one place and keep it there until you want to change it
 
I was able to do it using this Youtube video
Basically you add another series of xy data to an existing one so in that example I just changed the dates to strike prices and than you just have to figure out the height of the vertical line and when you change the strike price the vertical line moves
I used the scatter with straight lines for the chart type
 
Top
Contact Us