You are using an out of date browser. It may not display this or other websites correctly.
You should upgrade or use an alternative browser.
You should upgrade or use an alternative browser.
How to find stocks with weekly options in a trading range on TOS
- Thread starter Brooks
- Start date
Check out this think script by mobius
It came up with CSX
Only problem I see is stocks with narrow trading range have low volatility so not much premium available if that is what you are looking for
It came up with CSX
Only problem I see is stocks with narrow trading range have low volatility so not much premium available if that is what you are looking for
Thanks for your post and asking on reddit. You're right, of course, with lower volatility the premiums will be lower.Check out this think script by mobius
It came up with CSX
Only problem I see is stocks with narrow trading range have low volatility so not much premium available if that is what you are looking for
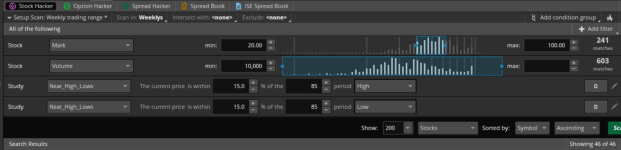
I did later find a TOS study called Near_High_Lows which is providing the scan I was looking for. I am going to look into the TTM Sqeeze suggested.
Sounds like the right one. I looked into the TTM Squeeze and it looks like the opposite of my objective. It finds symbols about to break out of their channels. It is an interesting indicator though.I found a near high thinkscript not sure if it's the same but it looks good I had AXP ,ABT and a few others in the result
@Brooks: I don't know precisely how you wish to define (within a range). I just hacked a quick Custom study, (Custom studies can be used in the sorting of TOS Scans) to look for %change in prior 90 bars (days) and fix a threshold (set to 10% here, that you can alter) that will effectively discard by returning a zero for those over that threshold (an attempt at what you may want for range) and provide higher weighting to lower percent changes. -- I used "Custom 1" see below:
# Brooks response for a custom thinkscript to aid in quantifying sideways movementPercent of stocks over LookBack bars(days)
# Must insure aggregation is set to days for bar to == days.
input LookBack=90; # Days
input PercentLimit=10;
def highest=highest(high,LookBack);
def lowest=lowest(low,LookBack);
def range=highest-lowest;
def lineinsand=highest-range/2; # pick mid point
def movementPercent=100*(range/2)/lineinsand; # How much movementPercent
plot Weighting=if (movementPercent>PercentLimit) then 0 else PercentLimit-movementPercent;
Pic of a scan setup:
# Brooks response for a custom thinkscript to aid in quantifying sideways movementPercent of stocks over LookBack bars(days)
# Must insure aggregation is set to days for bar to == days.
input LookBack=90; # Days
input PercentLimit=10;
def highest=highest(high,LookBack);
def lowest=lowest(low,LookBack);
def range=highest-lowest;
def lineinsand=highest-range/2; # pick mid point
def movementPercent=100*(range/2)/lineinsand; # How much movementPercent
plot Weighting=if (movementPercent>PercentLimit) then 0 else PercentLimit-movementPercent;
Pic of a scan setup:
Attachments
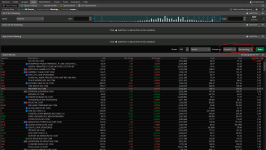
Hats off to you, Gary, writing thinkscript to do this. I found someone who knew how to do this with a study called Near_High_Lows. Attached is the saved study and results. I think its 2 different ways that both work to solve the problem.