
You are using an out of date browser. It may not display this or other websites correctly.
You should upgrade or use an alternative browser.
You should upgrade or use an alternative browser.
Interesting Charts dujour!
- Thread starter Tb2018
- Start date
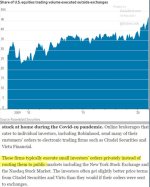
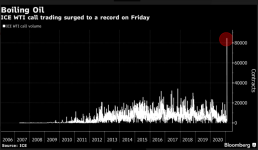
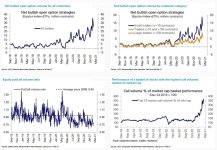
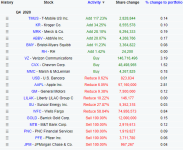
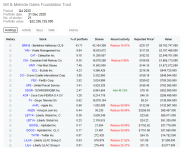
Looking at those charts it looks like traders are almost 3 times more bullish now than before the pandemic and a lot of those are small lot traders which is good if you want to keep the losses small but when they all head for the exits it is going to affect the market as other are going to pile in as well
Watch out when the fed removes the punch bowl or some other small event that starts the ball rolling it's just a matter of when
Watch out when the fed removes the punch bowl or some other small event that starts the ball rolling it's just a matter of when
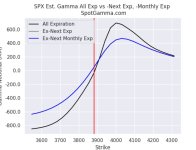
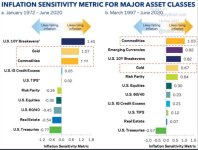
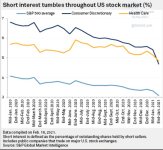
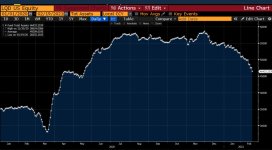
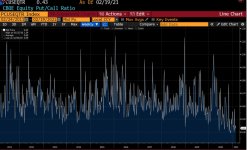
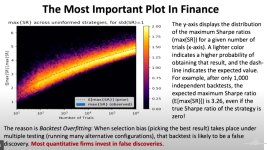
This is very interesting. When I look at quant posts on social media. I always see beautiful equity curves, other plots, and miscellaneous tables to support the results (often along with claims like "been trading this live since 1/3/2017"). I never see all information provided, though, that would allow me to truly evaluate the strategy.
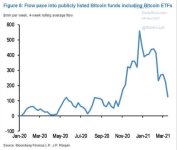
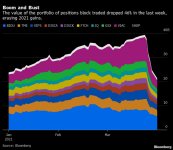
Archegos story repeat of low rates & liquidity pumped to equity markets by shadow banks, hedge funds & market is up so does overleverage & when conditions tighten liquidation happens with hedge funds failing to meet margin requirements leading to ponzi scheme unraveling.
Is this a “one off” or are there likely more of these hidden away ?? I mean I know it’s a bit more likely right now with “infinite” lending and capital but still - tip of the iceberg or was this the iceberg ?
Interest rate vs equity "fear" - two different worlds
SRVIX vs VIX "gap" is once again getting very extreme.
Equities are not realizing much volatility nor is much "exogenous" risk being priced in.
Latest mini turbulence with regards to the implosion of Archegos is so far just an isolated event, but there are probably many risk managers looking through the portfolios and the average order book, simulating scenarios in a new way.
Yields have so far today put in a big shooting star candle. Let's see if we get a pause in yields and rates vol as that SRVIX vs VIX gap isn't sustainable.
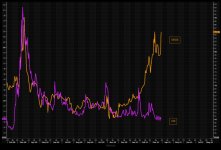
SRVIX vs VIX "gap" is once again getting very extreme.
Equities are not realizing much volatility nor is much "exogenous" risk being priced in.
Latest mini turbulence with regards to the implosion of Archegos is so far just an isolated event, but there are probably many risk managers looking through the portfolios and the average order book, simulating scenarios in a new way.
Yields have so far today put in a big shooting star candle. Let's see if we get a pause in yields and rates vol as that SRVIX vs VIX gap isn't sustainable.
I had no idea about existence of SRVIX.
I look at those type of charts with an eye of a trader (vs model-driven-economist).
Yeah, "something needs to give" but "how" and "when"? I don't suppose anybody thinks those charts are driven by economy. There is so much craziness going around.
I have abundance of downside protection but not much for upside - this is result of my model-based-thinking. Can we have rates going up an markets going up? Trader says: "maybe" - and starts to think how to get ready for further upside without exposing much of downside... especially the Big one
(Again, thanks for those charts Tb2018 - maybe I should look at them more often).
I look at those type of charts with an eye of a trader (vs model-driven-economist).
Yeah, "something needs to give" but "how" and "when"? I don't suppose anybody thinks those charts are driven by economy. There is so much craziness going around.
I have abundance of downside protection but not much for upside - this is result of my model-based-thinking. Can we have rates going up an markets going up? Trader says: "maybe" - and starts to think how to get ready for further upside without exposing much of downside... especially the Big one
(Again, thanks for those charts Tb2018 - maybe I should look at them more often).