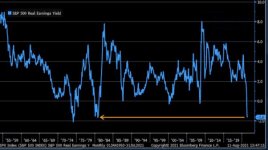
A couple of them barely missed the iceberg I just heard about Morgan Stanley on CNBC a couple of hours agoIs this a “one off” or are there likely more of these hidden away ?
Morgan Stanley, Goldman dodge losses from Bill Hwang fund meltdown
When investors are stampeding for the exits, it pays to be first out the door.That is what happened when falling shares in ViacomCBS last week ignited a US$20 billion wave of forced selling at the Wall Street banks that cater to Archegos Capital Management, the family office founded by former...
 www.thestandard.com.hk

Deutsche Bank Dodged Archegos Hit With Quick $4 Billion Sale
Deutsche Bank AG sold about $4 billion of holdings seized in the implosion of Archegos Capital Management in a private deal Friday, helping it emerge unscathed from a scramble that may cost some rivals billions of dollars.
 www.bloomberg.com