long term diagonals

jim leahy

Active member
no one seems interested in earnings trades, how about long term diagonals. in this trade i buy a deep out of the money
put, 4 or more months out, and sell shorter term slightly out of the money puts against it. for the shorts i use weekly's, one
or two weeks out and roll them as they get near expiration. this is a limited risk, positive vega trade, but you have to be
careful about the volatility in the shorts. if volatility increases it can hurt the trade. the volatility of the longs won't go up as
much as the shorts. you definitely don't want to do these in front of earnings, but i sometimes do them the day of earnings
to get a head start on a longer term trade, and then just keep rolling the shorts out as they expire.

anyone else doing this kind of trade? i'm interested in your adjustment strategy and how well they've been working
for you. usually any losses are minimal but i've had a few with pretty large losses; ge, for example. most times i
can adjust them enough to keep ahead of the stock movement and make 3-5% a month. the latest one i'm in is
qqq, long june 165 put, short mar week2 173 and 172 puts. i've been in it for 15 days and it's up 5% on a $3800 max loss.
 
Great strategy although I have not been doing it. This is the main strategy employed in trading group 7, led by Himanshu who is a calendar/diagonal guru. You can join that group and share adjustment techniques.
Jack
 
long june 165 put, short mar week2 173 and 172 puts

Just to clarify are you selling 2 173 and 2 172 puts and buying 4 165 puts ?

Seems like you are at the sweet spot You may want to lock in the gains while you have them It's not clear which way the market will go after a trade deal is announced or not unless you are at the pc and ready to make an adjustment if and when something happens
 
Just to clarify are you selling 2 173 and 2 172 puts and buying 4 165 puts ?

Seems like you are at the sweet spot You may want to lock in the gains while you have them It's not clear which way the market will go after a trade deal is announced or not unless you are at the pc and ready to make an adjustment if and when something happens
i'm actually short 1 173 put, short 3 172 puts, and long 4 165 puts. the p/l is a little below 50% of the max
profit at this time. the expiration graph, of course, will change depending on what happens to volatility. i've thought
about exiting, but i can also roll out another week and expand the break-even points and increase the max profit.
it's always a tough decision to make.
 
the expiration graph, of course, will change depending on what happens to volatility. i

I know what you mean
That's why I don't like trading diagonals and calendars but with this low vol I may have to try it
Can you share the fill prices ?
Did you get in as a combo trade or individual legs ?
 
Can you share the fill prices ?
Did you get in as a combo trade or individual legs ?

i closed the trade today, mainly because the iv has decreased so much. the theory on this trade is you
buy the long term put and continue selling shorts over time against it. i was only in this trade 18 days but
even the longs lost a lot of money. when i entered the trade i entered it as a diagonal but i made several
adjustments along the way. when i adjusted the shorts i entered them as spreads or diagonals, closing
one and selling a new short. i don't want to fill this post up with pictures but they show the history better than
i can explain it. the fill prices are listed as well as the days to expiration as i did the adjustments. the chart shows
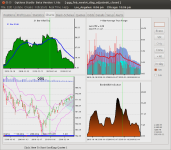
how the iv changed as well as how far qqq moved during the trade.

1869

1870

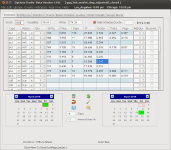
the above picture shows the opening prices and greeks.

1871

the blue/gray cone shows the 1 and 2 standard deviations of qqq since i opened the trade.
 
Thanks for sharing
I didn't realize you already made some adjustments
Sounds like you are managing it well

That software you are using to make the graph looks interesting
Did you make that ? Is someone selling that ?
 
one thing i should mention is that i can't trade through the analysis software so it picks up mid-prices.
after i do a trade i have to adjust the prices but that's somewhat of a pain. with qqq and spy the spreads
are 1 or 2 cents so i don't bother fixing prices. sometimes i get price improvement, others not, so the
final p/l might be off by a few dollars.

the software isn't commercial. i think some of the other analysis programs can do similar charts.
 
I was wondering does that software keep track of the credit you received ?
In other words when the shorts expire and keep all the credit does that show up in the debit side of the trade ?

I know TOS does not do that probably because it looses the link as a diagonal so I have to manually reduce the debit side by the credit received to get a more accurate p/l at expiration
 
I was wondering does that software keep track of the credit you received ?
In other words when the shorts expire and keep all the credit does that show up in the debit side of the trade ?

I know TOS does not do that probably because it looses the link as a diagonal so I have to manually reduce the debit side by the credit received to get a more accurate p/l at expiration
in a way it keeps track of the p/l credits and debits. i can't actually let the the options expire. it needs
to have a closing price and closing date. when i do a roll it will record the closing price for the existing strike
and add the new one. if i'm not adding a new strike it will just record the closing strike. you can see this in
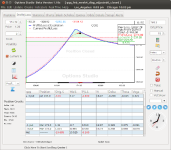
the first picture, above, that shows the risk graph. in the upper right hand corner of the graph there's an insert
showing the p/l and max loss and max profit. the entry for "locked in" shows the cumulative p/l for the closed strikes
and the line for "profit/loss" shows the p/l for the existing strikes. the "net" sums them.

i thought there was a way in thinkorswim to keep track of the trades. you have to keep an entry for duplicate
trades and opposite trades as you make adjustments. i know this works for trades expiring at the same
time. i thought it also worked for diagonals and calendars.
 
Yes you can track all debits and credits in TOS by sending all your trades to the analyze tab from your trade history. You can then save the simulated trades as a file that can be imported at anytime irrespective of the expiry month or calendar/diagonal. When you look at the risk graph ensure you are not combining it with existing positions.
 
it will record the closing price for the existing strike
and add the new one.

I understand that it will record the closing price but does it adjust the expiration graph is my question ?

So if you have a debit option that you bought at $1.00 let's say you can look at the graph and see that as the line that is below zero So than let's say that you get 50 cents credit so if you close or let the shorts expire you should see remaining debit option being only 50 cents below

this is not happening in TOS

You can then save the simulated trades as a file that can be imported at anytime irrespective of the expiry month or calendar/diagonal
That is true for trades that have not expired Once they expire they no longer have any value so there will be no graph to show

When you look at the risk graph ensure you are not combining it with existing positions.
Well in this case I do want to combine the trade that expired with the existing trade but that is not possible
So I just have to adjust the debit side manually to reflect the real p/l of the debit trade on the expiration graph
 
I understand that it will record the closing price but does it adjust the expiration graph is my question ?

So if you have a debit option that you bought at $1.00 let's say you can look at the graph and see that as the line that is below zero So than let's say that you get 50 cents credit so if you close or let the shorts expire you should see remaining debit option being only 50 cents below

this is not happening in TOS
it will not be reflected in the expiration graph, but all the previous trades are reflected in the current p/l graph,
commonly referred to as t0. all the profits in my trade occurred in the strikes that were rolled. the remaining
strikes show a loss. the profit/loss t0 curve is offset by the previous profits.

this is getting off-topic and is better answered in a different thread so others with the same question can find
the answer. no one will look here for thinkorswim issues. however, thinkorswim will keep track of all the
adjustments and expired options as long as you set it up correctly in the "positions and simulated trades" section
of the risk profile. you have to duplicate all the trades as simulated trades and lock the prices as they are
closed. you can save them to a file and load it later as you make further changes. if you start a separate thread
for thinkorswim problems i'm sure you'll get better, more detailed answers.
 
it will not be reflected in the expiration graph, but all the previous trades are reflected in the current p/l graph,
commonly referred to as t0. all the profits in my trade occurred in the strikes that were rolled. the remaining
strikes show a loss. the profit/loss t0 curve is offset by the previous profits.
correction: it also gets reflected in the expiration graph.
 
Well in this case I do want to combine the trade that expired with the existing trade but that is not possible
So I just have to adjust the debit side manually to reflect the real p/l of the debit trade on the expiration graph

Status1,
If you follow the simple steps I outlined above you will achieve what you want to do. Instead you seem to debate and criticize every item. I get the impression that you really want TOS to follow the process in your mind as opposed to following TOS process. Simple solution, develop your own software. For example it is ridiculous for you to insist on combining simulated trades with existing positions after many adjustments to get the correct risk graphs & P/L. Does not work that way in TOS. The best way to learn is to first understand the process and then you can improve on that later. This is my last post on this subject.
 
Thanks Jim leahy and JackW for your tips and advice

I was in now way criticizing anyone I was just disagreeing with the steps because I thought that leaving the trade on the simulated page would be the same as exporting it and importing it back which it normally is except when the trade expires

For some weird reason when the weekly expiration in SPX expires normally it would say "not traded " and I am not sure if this is a new behavior or I just never noticed it before because I was trading monthlies but in the recent year I noticed that the weekly expiration no longer says "not traded" it just goes to the next expiration So my Mar 4 expiration turned into the Mar 6 and now it's in the Mar 8 expiration all by itself

I would like for TOS to follow it's own process and keep the expired trades expired and not move them to the next expiration
I don't think that's too much to ask
At least now I know a better way to track my trade
Thanks for your help

By the way the trade I was working on worked out very well but now with the higher vol it may not work as well so I will probably go back to credit spreads
 
back to long term diagonals...
one thing to be aware of if trading these using weeklys for the shorts, like i do, is on days like today you may have to
do more than one adjustment a day. early in the trade, large stock movements are particularly problematic.
the gamma on short term options is high and there's not a lot of margin before you start losing a lot of money.

you may have to adjust the same strike twice, which if you have a smaller size account you might get hit by
the pattern day-trading rule. this rule applies to accounts less than $25k. brokerages have different rules for
this so if your account is under $25k you should be aware of the rules.
 
Understood

I am trading the SPX a little different though
This was just a simulated trade
I bought a 1 lot wide strangle one month out and than also sold a 1 week asymmetrical iron condor
Yes the gamma goes high in one week which is expected but the shorts are wide apart so there is no immediate danger in a low vol plus with the short expiration the trade will expire worthless before it has a chance to move a lot in one direction

So after the first week expired worthless the premium from the iron condor made the long strangle above zero by $640
Than I placed another iron condor for the next week with the same strikes and as the market came down the trade quickly expanded
to the top of the condor so by Mar 6th the trade showed $2560 in profit and if this was a live trade I would have taken profits at this point but I left it on just to see what would happen

I had a choice to make an adjustment yesterday and now I am tracking it both ways just to see if the adjustment would make any difference
Because of the high vol at the moment and SPX going down the iron condor is tilted up on the downside so it actually shows more profit now than when it was in the middle near the top of the condor

I will see how it looks on Monday when the weekly expires but so far this trade has a good potential in a low vol
 
Top
Contact Us