MOC Imbalance - Is there an edge?

gariki

Member
Hello folks,

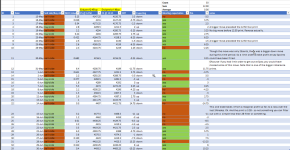
I am setting up a study to test somewhat quantitatively if there is an edge in moc imbalance data available from financialjuice.com

As of now just did a basic setup of what i want to measure and test. If you guys have any feedback like changes to parameters to test, additions to what is being tested etc please comment and can update the study (if it doesnt add a ton of work).

Also, if anyone wants to collaborate and collect some information before I analyse the data, please post here or message me and i will send the excel sheet. We can divvy up and get more data points.

More details here:
https://siramcapitalresearch.substack.com/p/moc-imbalance-is-there-an-edge-part


Regards!
-gariki
 
marketchameleon.com has some historical data on this. i don't know when they're sampling it but in theory
you could compile past data and use market historical prices to fill in your spreadsheet. intra-day data for spx
should be readily available. the marketchameleon imbalance data appears to be free.
 
Hello Gariki,
looks like you set up some fun for yourself.
I did put few trades around MOC, just to experience it. Nothing to write home about.

I'd gladly join the fun with you but lately I'm preoccupied with a study of calendars trades and prefer to stay focused, so - not this time.

For your consideration, here are some questions/ideas I'd like to have answers about MOC trading.
1. what is pure correlation between MOC number and SPX direction
2. then what is the correlation between size of MOC number and size of SPX move
3. I'd like to find if there is any MOC number that when above, renders better correlation. For example how correlations from 1) and 2) change when you ignore all data with MOC, lets say, below 2B. Do the same for about -/+1B differences, then you may tune up those if needed.

Those should make a good start but even if you simply plot MOC data and SPX data on the same graph you should spot what is going on.

For data, I imagine, you use Moc number from posting at 15:50 and examine SPX move in last 10 mins of trading. From my observations: if the move comes (as MOC suggests) it happens with a delay, even 5 mins later, often with first short move in opposite direction (good entry point but can be a local phenomena only).
I don't know since when MOC data are available but I'd rather focus only on past 3 or even only last 2 years of trading. For what I see market changed a lot since daily options were introduced. Options market that is. I haven't look much around beside SPX options though.

Good luck with the study and have a fun!
 
Last edited:
Hello Gariki,
looks like you set up some fun for yourself.
I did put few trades around MOC, just to experience it. Nothing to write home about.

I'd gladly join the fun with you but lately I'm preoccupied with a study of calendars trades and prefer to stay focused, so - not this time.

For your consideration, here are some questions/ideas I'd like to have answers about MOC trading.
1. what is pure correlation between MOC number and SPX direction
2. then what is the correlation between size of MOC number and size of SPX move
3. I'd like to find if there is any MOC number that when above, renders better correlation. For example how correlations from 1) and 2) change when you ignore all data with MOC, lets say, below 2B. Do the same for about -/+1B differences, then you may tune up those if needed.

Those should make a good start but even if you simply plot MOC data and SPX data on the same graph you should spot what is going on.

For data, I imagine, you use Moc number from posting at 15:50 and examine SPX move in last 10 mins of trading. From my observations: if the move comes (as MOC suggests) it happens with a delay, even 5 mins later, often with first short move in opposite direction (good entry point but can be a local phenomena only).
I don't know since when MOC data are available but I'd rather focus only on past 3 or even only last 2 years of trading. For what I see market changed a lot since daily options were introduced. Options market that is. I haven't look much around beside SPX options though.

Good luck with the study and have a fun!
Excellent feedback Marcas.

Yes; all three of the things you listed.. i think i will have some quantifiable answer by the time i am done with collecting data and analyzing.

And yes; i am going to look at the move between 15:50 and 16:15 (/ES should move after close and that should be due to the activity happening due to moc orders, though spx wont be moving). And keeping it simple; no optimizations - to avoid any curve fitting. If there is some edge (i suspect there is due to a structural thing that all these buy/sell orders are coming in - similar to a calendar day effect), it should showup in data. If not, then ha.. 1 point to efficient markets.

And yes. I dont think i will go even as back as 2 years at all. After 20points if I dont see any consistent edge I will have lost my interest in it (though i will probably collect some more points just because i am posting the data) - hard to keep trading if you wont be making any money after 20 trades.
 
Thank you for kind words.No, no curve fitting. If I understand correctly your intention is only to look at data. This is the right thing to do, imo. Only after that you may think of developing a strategy and then you will deal with 'curve fitting. problem. I suspect there is not enough data yet to create any solid strategy around MOC yet - I can be wrong.
One thing I forgot to mention is to look at volume. Volume for this period and for the whole day and even for few days before - to have a good handle on it. I suspect that 2B imbalance will have different effect when show up on high liq day vs poor liq day.
Also remember that MOC does not tell you the whole story. It shows only orders of institutions that are required to report. (This is a point that can be used for market manipulation - but I thing the edge for that is small - again: my opinion only, uneducated opinion).
 
Thank you for kind words.No, no curve fitting. If I understand correctly your intention is only to look at data. This is the right thing to do, imo. Only after that you may think of developing a strategy and then you will deal with 'curve fitting. problem. I suspect there is not enough data yet to create any solid strategy around MOC yet - I can be wrong.
One thing I forgot to mention is to look at volume. Volume for this period and for the whole day and even for few days before - to have a good handle on it. I suspect that 2B imbalance will have different effect when show up on high liq day vs poor liq day.
Also remember that MOC does not tell you the whole story. It shows only orders of institutions that are required to report. (This is a point that can be used for market manipulation - but I thing the edge for that is small - again: my opinion only, uneducated opinion).

Very good insight Marcas wrt poor liquidity days having a bigger impact. I suspect I will dig in that far though. Something for someone else to run with :)

And i do see that i have the time stamps incorrectly set as 11:50 and 12:15; they should have been 12:50 and 1:15 (PST). Around market close.

Quick note: I just began collecting info and am seeing some interesting things. Will post soon.

Here is a sneak peak:
1688221984134.png


-gariki
 

Attachments

  • 1688221533985.png
    1688221533985.png
    19.4 KB · Views: 1
Last edited:
Top
Contact Us