OptionVue's VXX Trading System

If I´ve interpreted the VRP and RY data correctly over the time period tested it never paid off to be long vol. using the rules for either strategy. As I mentioned above the RY strategy is similar to OV´s old VXX trading system when you´re never in cash.

Correct, long trades didn’t perform well. RY faired a little bit better. But the sample size is small so can’t draw a strong conclusion. I planned on looking at RY more closely, see if can incorporate it into an intra day long vol strat

One question regarding your BWBs, did you formerly trade 2-legged debit/credit spreads but found BWBs gave better returns?

Actually it’s the opposite. When I started out, I decided to trade BWBs b.c. it’s a structure I (and many other members here) am familiar with. Now I think if I have a good timing system, then VXX debit spreads would offer better risk reward. Ali Pashaei gave a very good presentation on this topic not so long ago.

Posted by Nam
 
Actually it’s the opposite. When I started out, I decided to trade BWBs b.c. it’s a structure I (and many other members here) am familiar with. Now I think if I have a good timing system, then VXX debit spreads would offer better risk reward. Ali Pashaei gave a very good presentation on this topic not so long ago.

Thanks Nam, that´s what I thought, simple credit/debit spreads are a better set-up so wasn´t sure why you used BWBs. I backtested mechanical weekly 28 DTE put debit spreads (long ATM) with 1% portfolio in periods when OV advocated a buy and worked very well. Like you mentioned you don´t need to worry about positve theta, when term structure is falling south it´s irrelevant. I´ll check out the webinar you mentioned.

Posted by DavidF
 
Most of this stuff is way over my head.
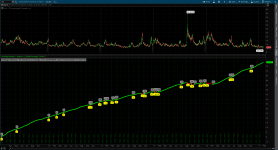
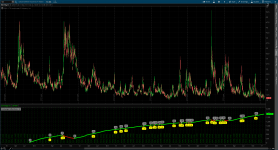
I played around with trying to merely visualize the difference in the front and back month VX futures, to get a sense of how the contango would impact SVXY or XIV.
Here is a TOS Thinkscript that merely examines the difference, if you are curious.
.txt appended to the name to allow posting here. -- it is a thinkscript text file.

I am attaching a visual of running the script. Simple view. Note: this is merely running value of BM-FM to visualize Contango as reflected in FM/BM VX Futures.

upload_2017-2-3_12-8-35.png
 
Eric:
I may not be interpreting your request properly, so If I miss, let me know. The current implementation merely adds the difference between the front and back month. I am attaching a modified version that adds another input control "relative", which defaults to zero, but can be set to one, to replace the difference by the difference/"backmonth" for a relative change. - I added count and % to the label. -- If you examine time more than 5years, the relative input does not work (I think this may be a ThinkScript complexity issue, as this script has iterations, that causes ThinkScript some grief. -- I hastily put this together without verification, so beware!

upload_2017-2-3_15-35-1.png
 

Attachments

Hi Steve. No, I look at the "gestalt" of the risk graph, and adjust the strikes to a configuration similar to this one: here is one on XLY (very liquid) which I launched about 10 minutes ago.

View attachment 2478

Of course, I only use this strategy in relatively low volume environments on underlyings which appear overextended and about to roll over.

Hi Dan! New member here, studying a bit more on each CD strategy then deciding on which to start with subscription... Likely RTT...
I did have a question regarding your diagonals &/or calendars. You mentioned somewhere that you primarily trade PUTS to avoid dividend risk - that being said, say you had a bias to the upside on a particular underlying, would you ever launch one of these trades with an ITM short strike in the front month??

Posted by TBY
 
Large upside moves are killers to diagonal spreads, since they are long vega positions. The back cycle leg will be hammered. An ITM short strike would also be hit by an upside move, although it would eventually lose its time value. Am I misunderstanding your question? Perhaps you could provide an example.
 
Hi Dan, think my question needs to be clarified & it may just be a bit 'simple'... So I can see how it was confusing.
You had said you only trade on the Put side for multiple reasons (avoiding dividend risk, skew, etc...) that being said, with the understanding that Diagonals and Calendars are put on for neutral to slightly directional bias, say your bias was to the upside and you wanted to position your put Diag/Cal accordingly, would you sell an ITM front month strike??? I'm just trying to understand a bullish Diag/Cal assumption with using Puts only...

Posted by TBY
 
OK, TBY. The best answer that I could give is that I would never launch a diagonal or calendar with an upside bias because both are long vega trades. So, as the market goes up, volatility falls, and the position is hurt by vega.
 
Thanks! out of curiousity, and maybe you have answered it in a webinar or blog, what would be your go to upside strategy then? Credit spreads?

Posted by TBY
 
Well, the RTT usually makes decent money even in market rallies, so that is one of my upside strategies. I always study the SPY chart, looking for a long entry possibility. I tend to accumulate shares over time in a dollar cost averaging fashion, but I will book profits after a long run. Then, I look for entry points again. I tried ETF sector rotation strategies, but became frustrated very early. Finally, we have the bulk of our holdings in a firm which manages that account using primarily ETFs (equities and bonds). These are bought and sold very judiciously and not as a specific rotation strategy. I have not been personally successful with upside directional option strategies (except for RTT). Other traders like to buy ES futures, sell put credit spreads, or buy deep ITM long-dated SPY options. Perhaps other subscribers would be willing to add their inputs.
 
A simple put credit spread strategy with rules for risk control such as a bear market and or volatility filter can have quite a good yield over time and be deceptively simple to manage. You would need Optionvue or Option Net Explorer to develop and back test the strategy since Thinkorswim's back testing capabilities are too limited.
 
TBY, you might be interested in subscribing to PowerOptions (poweropt.com) if you are interested in other options strategies. You can use their recommended criteria for a variety of strategies, or build your own.
 
Eric:
I may not be interpreting your request properly, so If I miss, let me know. The current implementation merely adds the difference between the front and back month. I am attaching a modified version that adds another input control "relative", which defaults to zero, but can be set to one, to replace the difference by the difference/"backmonth" for a relative change. - I added count and % to the label. -- If you examine time more than 5years, the relative input does not work (I think this may be a ThinkScript complexity issue, as this script has iterations, that causes ThinkScript some grief. -- I hastily put this together without verification, so beware!

View attachment 2484

Would it be possible to create a version of this indicator that simply shows the difference between the back month and front month, rather than accumulating the total contango over a time period? So if front month futures are 12 and second month is 14 then the indicator returns 2. If the number is positive then you have contango. I do find noting the absolute level of contango present each day to be useful, but not the accumulated contango over a time period. Thanks!
 
Chris:
For some reason I am no longer able to post files here, but here is a link.
Changes to the script:
2nd input now named "flavor"
flavor=0; Original implementation of cumulative difference in BM-FM VX Futures
flavor=1; Relative cumulative difference in BM-FM VX Futures
flavor=2; Absolute difference of BM-FM VX Futures (your request)
you may wish to turn off bubbles input for this;
The contango thinkscript for BM-FM VX futures plot.
http://tos.mx/wrCbV8


I like this view. Thnx for the suggestion!

Let me know if you spot issues, as I did very little verification.
Regards,
Gary
 
I think this is the original paper Yates published years ago:

http://www.optionvue.com/files/Trading_the_VXX.pdf

After it came out I attempted to replicate the results but was unable to do so. Yates' backtesting methodology was a bit flawed and he made assumptions he shouldn't have (long XIV and short VXX are not mirror images, especially when the differences compound over time). I corresponded with him to point this out and his reply was basically "go away". He also has a bad habit of changing the model after experiencing a drawdown. While he calls it "improving" the system I call it over-fitting the data. Bottom line, in my opinion his system is far from robust.

I personally have subscribed to two newsletters/signal services for a couple years... vixstrategies.com and tradingvolatility.net... that trade XIV and VXX long-only. Both are the best I've come across and they both return in the ballpark of 120% average annual return and 35% drawdown. And they don't change their models after every drawdown. Plenty of good info on both websites regarding their approaches for those who wish to attempt to replicate their models for themself. Tradingvolatility.net has the more useful website with vol-related data, and you can monitor the signal intraday to watch for potential signal changes. (I have no connection to either site other than being a subscriber.)

Hope this helps...
 
Back in 2012 Larry McMillan wrote about a system for trading the VXX & XIV in his newsletter based on the price difference between the first two months in VIX futures. If you understand how the ETNs are managed it isn't difficult to come up with your own rules to back test.
 
Top
Contact Us