Python - Butterfly Spreads

Rickbw123

Member
Gold Member
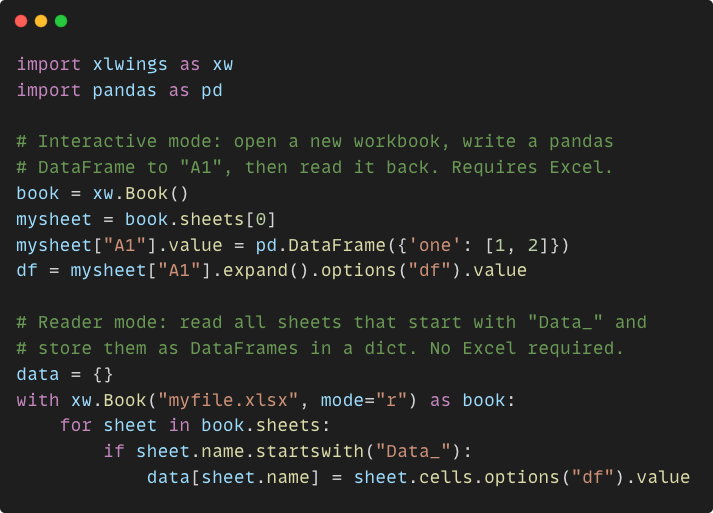
Didn't see any messages in this folder, so I figured I would kick it off. I've been working on using Python & XLwings to work on Butterfly strategies in Excel. It is still a work in progress, but if anyone else would like to collaborate, let me know! (I attempted to upload the file but the Python extension "*.ipynb" was not allowed).

1649514784347.png
 
Good to hear somebody is working on trading codes. I also use py but without Excel. I wander how and why do you use Excel.
I'm not quite clear on what do you mean by "XL wings". Is it 20points, 50? 100? 200? To bad you can't post your code. Maybe zip it? I'm interested to see what you are doing with those BFlies?
Side question: did anybody try to use Kivy as GUI for apps?
 
Hi Rick and Marcus,

Thanks for sharing your thoughts and insights. I'm just starting in on both of the API's for ToS and IBKR in Python. Lurking and following right now, hoping to contribute as I ramp into the project(s).
 
Rick, I work with python and python TDA api, TDA api allows my bots to directly get data both my equity and options(SPX, SPXW)
and place trades in my account. Are you using excel RTD for data? wondering....
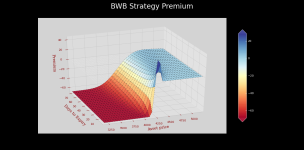
encl: SPX BWB payoff graph..
 

Attachments

  • Figure_1.png
    Figure_1.png
    214.3 KB · Views: 26
pip install xlwings
I thought that XLwings relates to size of butterfly wings :)
My bad.
Thanks for info but I can not use xlwings for couple reasons. Most obvious is that I do not have Excel. If I had one on my system I'd still prefer doing everything in python alone it's cleaner this way. Not sure what Excel can offer but I understand that people are familiar and good using Excel. Doesn't really matter.

I looked at your code. Seems that goal of your exercise was to plot an expiration graph of a call rBF (regular butterfly). This is good as you will be plotting those often. If I may I advise to name variables in a way that wont obstruct code readability ;) . I know it is only an exercise but if you look at this code in a month you will have to spend time to re-understand what you have written. I'm talking by experience :)

I see that you imported seaborn. Do you use it? I know about it but never really tried. I think it produces pretty graphs.
Played with your code but didn't want to change much.
Next step, I think, would be to find some BSM code and plot t lines... :)


@S76 what graphic lib do you use? Is it py? I plot plenty of graphs like yours and use plotly.
Nice looking one!
 

Attachments

Marcas,

The Jupyter Python file I shared is one I got from Github that I adapted some code to. I am more used to Pandas, Numpy and Matplotlib (all the time in Jupyter - Anaconda).

I use XLWings to go back and forth to my Jupyter file & excel. Excel runs much faster this way and I can have thousands of rows & columns without slowing anything down. The computing power & speed in Python allows me to evaluate stocks in a way excel would never be able to do on its own (my opinion). I actually use DTN IQFEED for equity data and have an addin to excel called XLQ:


I'm addicted to excel :)

Rick
 
Pandas is the way to go when dealing with data in Py. Also nothing wrong with Jupyter - it will speed up learning process.
I understand addiction to Excel but when/if you start using Py it will became a drag.
Good luck with py adventure if you have any py-trading related questions - there are few traders here who use their own codes on daily basis. (That not necessary make us better traders but definitely serves as a source of fun and joy. Coding opens many doors and provides new perspectives... plus keeps gray mass busy.)
 
@S76 what graphic lib do you use? Is it py? I plot plenty of graphs like yours and use plotly.
Nice looking one!
Thanks Marc, it is python, old code from capital discussion and RTT trade days, use mplot3d module in that graph in particular. Yes, Plotly is nice and easy to code for web integration. This would be easy to do in plotly (fig = go.Figure(data=[go.Mesh3d......)
 
Plotly offers great web integration and is very handy for analyzing graphs. I use it for couple of years already and it's still under heavy development ...
That said, my new projects may require me dusting off mpl.
I know the graph you posted. This is RTT but many other trades, including new Box Trade, share the same characteristic. If you know what you are looking at, graphs like this can save you hours and hours of backtesting.
I didn't really use matplotlib for 3D, so your pic was a reminder that 3D is possible. I have to look at details of implementation as my data are not always perfectly clean. I'm bit spoiled by plotly... :)
 
Does anybody have Python script to read a TOS Account Statement export file into a SQL database that they can share? Account Statement files need to be split into separate sections (for Trade History, Order History, Cash Balance, etc.) to be imported into SQL tables or Pandas dataframes. I tried reading the files directly into Pandas but the file is like a "ragged array" with different numbers of columns in each section of the CSV. I want to build an account trade and equity tracker.
 
Rich, I do not have a code to share but can help you with tackling Account Statement.

In general the whole process may look like this:
1 save .csv file to disk
2 import this file to your python code
3 from imported data extract parts that interests you (you can use everything if you wish to do so)
4 put extracted data into df
5 do whatever you want - plot graphs, put it to SQL, use as input for other pieces of code, etc.

re3. examine how Acc Statement is constructed and what method can be used to extract sections interesting to you. Look for patterns.

There are many ways to skin this cat. Use the one that is the most comfortable. Ask if you have any questions
 
Does anybody have Python script to read a TOS Account Statement export file into a SQL database that they can share? Account Statement files need to be split into separate sections (for Trade History, Order History, Cash Balance, etc.) to be imported into SQL tables or Pandas dataframes. I tried reading the files directly into Pandas but the file is like a "ragged array" with different numbers of columns in each section of the CSV. I want to build an account trade and equity tracker.
Rich:
I have something similar, I use for tracking my trades. I do not place my trades in DB, however. (My interest is in the Trade History, and little else.) I continue to add features that are likely only useful for me . My current outputs are text to the console for detail and summary, and production of a csv file for the content (trade history) of interest.

Curious of your objective in placing your account statement info in SQL?
 
Hi Gary,

The SQL database is to manage production transaction data in a standard DB file format, to accumulate trade, order, and account balance histories, and then use SQL standard queries to access trade history and analyze performance. Then I will not have to write custom accessors for each program like I would with spreadsheets or other flat files; I can use SQLAlchemy.
 
Top
Contact Us