Red Bar High

JerseyJIm

Member
Gold Member
Listened to one of the old webinars, where Himanshu was talking about the Red Bar High. Wondering how I could create an alert for it in TOS. The Red Bar High is basically just a red bar on an up candle, it seems like an interesting concept. It seems like it should be easy to create such an alert, but my knowledge of Thinkscript is very very basic.

I have been doing some learning regarding Thinkscript, and have found some excellent resources, but they seem to start with things a bit more involved.

Appreciate any guidance offered.
 
I heard him mentioning it a few times that I was on his presentation Not sure I got any real meaning out of it I mean it doesn't always mean it's a bearish signal You could have a red bar high and the next bar could be green or it could go down for a few days than gap up with a green bar
Sure in hindsight you could see where a red bar at one point may indicate a bearish signal but when you are live you don't know which way it will go so you need some kind of confirmation or just take chance and hope that it's in the right direction
Looking at a SPX chart I see a green bar high on 8/16/2022 so what does that mean ? The green bar is bearish now ?
Maybe it depends on the underlying but I have to found it reliable

As far as the alerts those are based mainly on certain patterns and not necessarily on the red bar high but you can start searching here
They have all kinds of thinkscripts that can be used on TOS You could just copy one and perhaps modify it to suit your needs
 
I heard him mentioning it a few times that I was on his presentation Not sure I got any real meaning out of it I mean it doesn't always mean it's a bearish signal You could have a red bar high and the next bar could be green or it could go down for a few days than gap up with a green bar
Sure in hindsight you could see where a red bar at one point may indicate a bearish signal but when you are live you don't know which way it will go so you need some kind of confirmation or just take chance and hope that it's in the right direction
Looking at a SPX chart I see a green bar high on 8/16/2022 so what does that mean ? The green bar is bearish now ?
Maybe it depends on the underlying but I have to found it reliable

As far as the alerts those are based mainly on certain patterns and not necessarily on the red bar high but you can start searching here
They have all kinds of thinkscripts that can be used on TOS You could just copy one and perhaps modify it to suit your needs
I have always placed zero value on technicals, but when Himanshu described the Red Bar High, I thought I would look at it. The green bar high on 8/16 (my anniversary) would mean nothing, since it is not a red bar high. But the red bar high a few days later on 8/26 would be a bearish signal.

In the Himanshu MP4, he claimed that it is somewhere in the 95+% range. I have no idea as to the validity of that, however any of the red bar highs I have looked at are greatly skewed to being followed by down moves.

Last Friday 11/18 was one, at least for RUT. Himanshu indicated that you will know it will be a red bar high at some point near the end of the day, say during the last half hour, and at that point, you enter the long put.

Not sure I will do anything with this, but just wanted to start getting some alerts when it happens to be aware of it.

He also mentioned the inside bar, which he uses to enter long strangles that he then sells short straddles against to calendarize them. I have found coding for the inside bar, just no mention at all of the red bar high.

I don't do any of this in my trading, but it might be fun to try a few red bar high trades.
 
Last edited:
I am not sure if that would be considered a red bar high on 8/26 as RUT was already coming down otherwise you could say any red candle is a red bar high I am not sure if he explained in great detail about the formation of the candle and which one is considered a red bar high and which one is not The way I understood it is it would be the highest red bar meaning at the peak of a swing high
The one on 11/18 was also after a green bar high on 11/15 however there was a red bar high on SPX on 11/15

The other issue I find is what is the time frame for this bearish signal ? Is it 1-2 days or a couple of weeks
Let's say you enter a long put What expiration do you use ? 1 week a month ? When do you take profits ? The next day, after a week, a month ?
Let's say the 11/18 was a red bar high and you placed a long put ATM I just used the Dec 2 expiration 10 DTE as an example

Using the think back the closing price on 11/18 for RUT was 1849 so you would buy the 1845 strike for 32.35
While RUT went down 10 points the trade is down about -$70 that's because the theta is -142 so at this pace RUT would have to be at 1812 at expiration to break even The market just opened with a gap up and the trade is down at the moment -$300 Do you use a stop loss and close the trade or let it ride ? How long ? Is there a profit target ?
 
I am not sure if that would be considered a red bar high on 8/26 as RUT was already coming down otherwise you could say any red candle is a red bar high I am not sure if he explained in great detail about the formation of the candle and which one is considered a red bar high and which one is not The way I understood it is it would be the highest red bar meaning at the peak of a swing high
The one on 11/18 was also after a green bar high on 11/15 however there was a red bar high on SPX on 11/15

The other issue I find is what is the time frame for this bearish signal ? Is it 1-2 days or a couple of weeks
Let's say you enter a long put What expiration do you use ? 1 week a month ? When do you take profits ? The next day, after a week, a month ?
Let's say the 11/18 was a red bar high and you placed a long put ATM I just used the Dec 2 expiration 10 DTE as an example

Using the think back the closing price on 11/18 for RUT was 1849 so you would buy the 1845 strike for 32.35
While RUT went down 10 points the trade is down about -$70 that's because the theta is -142 so at this pace RUT would have to be at 1812 at expiration to break even The market just opened with a gap up and the trade is down at the moment -$300 Do you use a stop loss and close the trade or let it ride ? How long ? Is there a profit target ?
I think that is correct, any red candle that is higher than the previous candle is considered a red bar high. I have listened to various of his sessions, and always have found them hard to follow, however the most recent one, which may have been a roundtable, made things clearer. Only the red bar high is the signal, green bar high is not. The opposite signal, the green bar low was also discussed, however it was indicated to be maybe 50-60% accurate.

During the webinar, he pointed out red bar highs one after the other, some at true trend peaks, others during downtrends, it did not seem to matter.

The other issues you point out, are the crux of the matter, what to do with the red bar high signal. My efficient market hat tells me that if it is truly accurate 95+% of the time, options prices (and even the underlying price) would just price it in and it would become ineffective.

As far as what trades to do, I have not done any work or testing, just have the thought that if I am about to enter a trade, and if it appears that the red bar high indicates some kind of drop coming (it could be big or small, short or long) it would be a good thing to consider the existence of a red bar high signal if there is one. Himanshu indicated that the red bar high is valid for all time frames. I have only looked at it on the daily chart.

If I were to do any trades, I would need a plan that considered the entry, the management, the exit etc.

What this has done most for me, is sparked an interest to watch other of his Trading Group 7 sessions, as I had stopped watching them.
 
some at true trend peaks, others during downtrends, it did not seem to matter.
If that's the case it should not be called red bar high it could be any red bar which doesn't make much sense to me
A red bar high should be at the very top of a swing high so most of the following candles would be lower

After some more searching I came across the video
It explains how you can create your own candlestick pattern
I just used it and did one with a green candle followed by a red candle higher and followed by another red candle lower and did a scan with it and found 6 stocks one of them was AMGN

The thing is just because it found one it doesn't mean it's a good candidate for a short because this 3 candle pattern is probably too common so it could be in an uptrend it finds the most recent pattern which may or may not be at the swing high

You can customize it further by adding more candles or different patterns so I think this is a good start
Hope that helps

By the way that simulation I did this morning with placing a long put on 11/18 on RUT is not looking too good It's down about-$1100 with this move up today
 
If that's the case it should not be called red bar high it could be any red bar which doesn't make much sense to me
A red bar high should be at the very top of a swing high so most of the following candles would be lower

After some more searching I came across the video
It explains how you can create your own candlestick pattern
I just used it and did one with a green candle followed by a red candle higher and followed by another red candle lower and did a scan with it and found 6 stocks one of them was AMGN

The thing is just because it found one it doesn't mean it's a good candidate for a short because this 3 candle pattern is probably too common so it could be in an uptrend it finds the most recent pattern which may or may not be at the swing high

You can customize it further by adding more candles or different patterns so I think this is a good start
Hope that helps

By the way that simulation I did this morning with placing a long put on 11/18 on RUT is not looking too good It's down about-$1100 with this move up today
Thank you for this!

It wouldn't be any red bar, just a red bar that is higher than the previous bar. A red bar that is not higher than the previous bar would not qualify.

All of this presumes that I understood Himanshu properly.

The YouTube link to the Roundtable is
 
Last edited:
I watched some of that video and he said he buys a put 30 days out and than later he may convert it to a calendar so he is not just placing a long put and waiting to make money
He says he closes the trade if it is loosing more than 20% which I think happens more often if you buy the long put at any other time other than at swing high
Looking at the Paypal example he was showing bars all over the place some are long and some are short trades which could have been stopped out unless you convert it into a calendar and than you could minimize the losses due to theta
It's easy to identify the red bar high in hindsight but I am not sure if it's so easy when you don't know what will happen in the future
 
I was playing around with this candle wizard and I think I came up with something that looks promising at least for the short term
It can be used to scan for stocks and seems to work pretty good
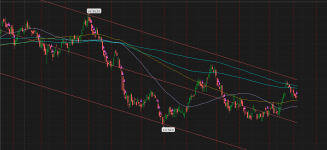
Here is one stock from the scan I think it works best in a downtrend
I set it up to look for 3 red candles with lower high and lower lows
Should be interesting to see what happens with the new signal on the last candle
TNC.PNG
 
I was playing around with this candle wizard and I think I came up with something that looks promising at least for the short term
It can be used to scan for stocks and seems to work pretty good
Here is one stock from the scan I think it works best in a downtrend
I set it up to look for 3 red candles with lower high and lower lows
Should be interesting to see what happens with the new signal on the last candle
View attachment 4366
Looks good, I have not used it yet, but will have some time over the long weekend. Happy Thanksgiving.
 
Here is the thinkscript that was generated with the wizard
# Generation time: 2022-11-24T22:04:01.733111Z

def IsUp = close > open;
def IsDown = close < open;
def IsDoji = IsDoji();
def avgRange = 0.05 * Average(high - low, 20);
plot PatternPlot =
IsDown[2] and
IsDown[1] and
IsDown[0] and
high[2] > high[1] and
high[1] > high[0] and
low[2] > low[1] and
low[1] > low[0];

PatternPlot.SetPaintingStrategy(PaintingStrategy.BOOLEAN_POINTS);
PatternPlot.SetDefaultColor(GetColor(0));

Previously I had it separately as part of the candlestick patterns in the upper right hand corner but I was also able to copy the thinscript and place it in the same folder as the other ones so I can now select it directly from there
 
I think that this might be it. Will try it out this week. Was reminded to get back to this during Himanshu's weekly meeting. Many thanks to Chat GTP.

# Define the current week's high, previous week's high, last week's closing price, and current week's opening price
def currentWeekHigh = high(period = AggregationPeriod.WEEK);
def previousWeekHigh = high(period = AggregationPeriod.WEEK)[1];
def lastWeekClose = close(period = AggregationPeriod.WEEK)[1];
def currentWeekOpen = open(period = AggregationPeriod.WEEK);
def lastPrice = close;

# Scan conditions
# 1. This week's high is greater than last week's high
# 2. The last price is below last week's closing price
# 3. The current week's opening price is above the prior week's closing price
plot scanCondition = currentWeekHigh > previousWeekHigh and lastPrice < lastWeekClose and currentWeekOpen > lastWeekClose;
 
I was trying to install that thinkscript you showed but I am getting an error for the plot statement
It says "Secondary period not allowed: Week." any idea what that means and how to fix it ?
 
I was trying to install that thinkscript you showed but I am getting an error for the plot statement
It says "Secondary period not allowed: Week." any idea what that means and how to fix it ?
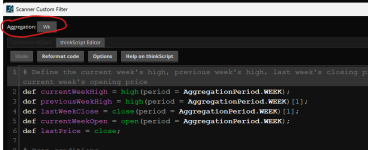
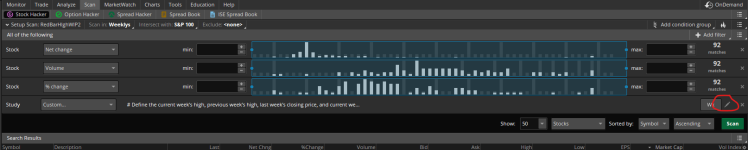
If you click on the edit pencil while in the scan, you have to change the aggregation to weekly.
 
Which line are you referring to ?
It looks to me that they all say AggregationPeriod.WEEK)
Maybe there are too many of them ?
 
Which line are you referring to ?
It looks to me that they all say AggregationPeriod.WEEK)
Maybe there are too many of them ?
In the bottom picture you select the pencil circled in red. In the top picture, make sure the aggregation at the top circled in red is weekly.

1709462478419.png1709462345650.png
 
Thanks
I thought it was something in the code
It's working now

Did you get a chance to evaluate the results ?
Could this be modified to be used on a daily chart ?
 
Thanks
I thought it was something in the code
It's working now

Did you get a chance to evaluate the results ?
Could this be modified to be used on a daily chart ?
I have only watched the scan various times last week but have been sporadically watching out for red bar highs since I first heard Himanshu discuss it. I chose the weekly aggregation after watching Himanshu's session last week, so I used it during the last hour of trading on Friday to identify a few symbols to start new put diagonals on.

I think it can be converted to work as a daily aggregation, I will have Chat GPT do it tomorrow.
 
Is it supposed to plot an arrow or something or just select a list of stocks ?
I did not see a red bar high in the near bars
 
Top
Contact Us