
A few years back, I wrote at thinkscript "vx_ref" to allow visualization of /VX Term structure contango, similar to what is available on VIXCENTRAL. This is great if that is precisely what you want, or you are trading products like VXX or UVXY, which are based on the VX Futures terms. However, if you are not trading those products, then that may be a poor tool to properly quantify the volatility (IV) changes in SPX. The impact of the expiring futures contracts is unwelcome information if you are trading SPX. Since elevated fear levels show up in the term structure, this may be useful (as opposed to observing 30-day IV in isolation) for gauging Fear (volatility).
I wrote a simple script to reflect the Ratio of VIX & VIX3M {like a Backwardation percentage) as an indication of Fear in SPX. The script has a "smooth line" for "highlevel view", and dots, to represent the Realtime difference, for the detail oriented of us.
Similar to the "vx_ref" study, two threshold inputs are available to help clarify ranges of importance to you. --The default settings are 0 and -10 (for Backwardation, and 10% from Backwardation).
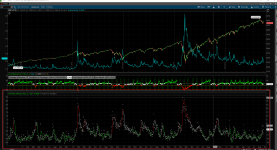
Here is chart with it and the vx_ref under SPX to show it has similar usefulness as the 2 front month VX futures difference, but without the futures roll disruption each month. I am also attaching the thinkscript for those who may be interested.
Improvement recommendations solicited. -- I continue to search for better ways to quantify SPX IV.
I wrote a simple script to reflect the Ratio of VIX & VIX3M {like a Backwardation percentage) as an indication of Fear in SPX. The script has a "smooth line" for "highlevel view", and dots, to represent the Realtime difference, for the detail oriented of us.
Similar to the "vx_ref" study, two threshold inputs are available to help clarify ranges of importance to you. --The default settings are 0 and -10 (for Backwardation, and 10% from Backwardation).
Here is chart with it and the vx_ref under SPX to show it has similar usefulness as the 2 front month VX futures difference, but without the futures roll disruption each month. I am also attaching the thinkscript for those who may be interested.
Improvement recommendations solicited. -- I continue to search for better ways to quantify SPX IV.
Attachments
Last edited: