I thought i saw the SKEW highlighted yellow on the Aeromir home page dashboard over one of the past few days even though it was in the 117 range. Can someone how the SKEW level would be viewed yellow or red? Is it simply the level or the level relative with other metrics? Have there been any posts of videos anyone can refer to in order to help me better understand how to use SKEW level. THANK YOU!

You are using an out of date browser. It may not display this or other websites correctly.
You should upgrade or use an alternative browser.
You should upgrade or use an alternative browser.
SKEW
- Thread starter Dan M
- Start date
tom will have to tell you what constitutes a yellow or red color on his dashboard but the below link
has skew information with links to white papers, a FAQ, and historical data.
http://www.cboe.com/products/vix-index-volatility/volatility-indicators/skew
has skew information with links to white papers, a FAQ, and historical data.
http://www.cboe.com/products/vix-index-volatility/volatility-indicators/skew
I am not sure how useful the skew is as a tool to use for making a trade decision
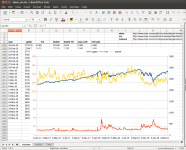
Based on that CBOE link assuming that 100 is normal the lowest it has been in 10 years is 111 and the average is 119 so maybe 119 should be the normal
On the other hand the upper range is 150 but it went to 159 on aug 13 2018 which I don't remember being any specially significant day
It seems like it's almost inversely correlated as the skew was lower in Dec as the market was crashing and higher a few months before that
I think probably the VIX might be a better tool to use
I am looking mostly at the price action and see how much premium I am getting at a certain distance from ATM
Based on that CBOE link assuming that 100 is normal the lowest it has been in 10 years is 111 and the average is 119 so maybe 119 should be the normal
On the other hand the upper range is 150 but it went to 159 on aug 13 2018 which I don't remember being any specially significant day
It seems like it's almost inversely correlated as the skew was lower in Dec as the market was crashing and higher a few months before that
I think probably the VIX might be a better tool to use
I am looking mostly at the price action and see how much premium I am getting at a certain distance from ATM
I am not sure how useful the skew is as a tool to use for making a trade decision
Hi,
if you mean SKEW index: I looked it up some years ago, didn't find it useful and, saying truth, I don't even remember what it is about - so I'm with you here about being 'not sure'. But if you are asking about skew of implied volatility graph, this is pretty much extremely important for making trade decisions, and pretty much all over spectrum of trades.
I suggest learning more about it if one didn't do it yet.
From Investopedia:
"To understand how the SKEW Index translate to risk, consider that each five-point move in the SKEW Index adds or subtracts around 1.3 or 1.4 percentage points to the risk of a two-standard deviation move. Similarly, a five-point move in the index adds or subtracts approximately 0.3 percentage points to a three-standard deviation move."
Does it work? That is an empirical question. If you can get historical SKEW data (I'm guessing you can) and compare to closing prices of the index, then you can see how accurate it is.
One potential problem is the larger you go with regard to size of move, the smaller the number of historical occurrences. You may hit a point where the number of historical occurrences of a move that large cannot possibly make for a large sample size.
"To understand how the SKEW Index translate to risk, consider that each five-point move in the SKEW Index adds or subtracts around 1.3 or 1.4 percentage points to the risk of a two-standard deviation move. Similarly, a five-point move in the index adds or subtracts approximately 0.3 percentage points to a three-standard deviation move."
Does it work? That is an empirical question. If you can get historical SKEW data (I'm guessing you can) and compare to closing prices of the index, then you can see how accurate it is.
One potential problem is the larger you go with regard to size of move, the smaller the number of historical occurrences. You may hit a point where the number of historical occurrences of a move that large cannot possibly make for a large sample size.