
You are using an out of date browser. It may not display this or other websites correctly.
You should upgrade or use an alternative browser.
You should upgrade or use an alternative browser.
ToS botchup..
- Thread starter gariki
- Start date
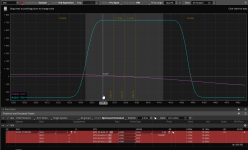
Yep, I see it too.
TOS's graphic library always (as I remember) produced rough graphs when pic was in zoom-out mode to the point it was hard to find strikes values from graphs alone.If I wanted to see exact graph I had to zoom-in like in your pic. But then graph was ok. The one you posted is not (not to expectations).
That's why I recommend building own tools. In this case if you look at graphs often it is nice to have steady graphic output regardless of what innovation platform brings.
I don't think this issue will last long before corrected. TOS is rolling from JDK8 to JDK11 - this may be connected somehow.
TOS's graphic library always (as I remember) produced rough graphs when pic was in zoom-out mode to the point it was hard to find strikes values from graphs alone.If I wanted to see exact graph I had to zoom-in like in your pic. But then graph was ok. The one you posted is not (not to expectations).
That's why I recommend building own tools. In this case if you look at graphs often it is nice to have steady graphic output regardless of what innovation platform brings.
I don't think this issue will last long before corrected. TOS is rolling from JDK8 to JDK11 - this may be connected somehow.

gariki
Member
Yep Marcas. I do have my own little excel dashboard i use to trade - I can almost trade exclusively with it. But i do supplement it with tos for charting. Someday i will integrate pnl curves also into the dashboard.
Anyways.. i did chat with tos support and they have confirmed that it seems to be an unintended update (aka a bug). Hope they will fix soon.
ps: must confess. I did try a bit to get pnl charts into excel but its not trivial (yeah..i know nothing comes easy but still). I think the only one I have seen do that successfully is probably Paul Demers on one of his presentations. I could be off though.
Anyways.. i did chat with tos support and they have confirmed that it seems to be an unintended update (aka a bug). Hope they will fix soon.
ps: must confess. I did try a bit to get pnl charts into excel but its not trivial (yeah..i know nothing comes easy but still). I think the only one I have seen do that successfully is probably Paul Demers on one of his presentations. I could be off though.
Last edited:
I'm sure TOS' issue is a temporary one.
I wish I can help with Excel but I have very little experience with it. I'm pretty convinced though that plotting expiration graph itself shouldn't be that hard. Well, it may depend on what you want to do but for simple graphs it cant be complicated. I imagine you calculate y values for x range and just plot it... That's how I do it anyway.
I plot my trades for years and find it very helpful especially when you include real p/l not 'TOS like'. Once you figure out how to do it you can add (and keep adding) helpful features that apply to your style particularly. I think I can trade with TOS alone if I have to, but man get use to any extras pretty fast
I will be out for some time now and not sure about web connectivity, but you may try old CapitalDiscussion Slack to find somebody to help with excel (not sure if Aeromir's Slack is active anymore).
I wish I can help with Excel but I have very little experience with it. I'm pretty convinced though that plotting expiration graph itself shouldn't be that hard. Well, it may depend on what you want to do but for simple graphs it cant be complicated. I imagine you calculate y values for x range and just plot it... That's how I do it anyway.
I plot my trades for years and find it very helpful especially when you include real p/l not 'TOS like'. Once you figure out how to do it you can add (and keep adding) helpful features that apply to your style particularly. I think I can trade with TOS alone if I have to, but man get use to any extras pretty fast
I will be out for some time now and not sure about web connectivity, but you may try old CapitalDiscussion Slack to find somebody to help with excel (not sure if Aeromir's Slack is active anymore).
Last edited:
gariki
Member
Thanks Marcas. It's already on my to-do list; maybe I will prioritize it again. If someone else wants to join in in the fun.. let's connect. I don't mind sharing the end result for everyone to benefit from (it's not easy to collaborate and work.. it comes with its own challenges but worth a shot).
@tom: Seems like i found an unintended feature on these boards - every time some one mentions "one" the word as in Marcas's post above - its putting in a subscription link for OptionnetExplorer. For a second i wondered if Marcas was affiliated with them.
ps: hmm.. and it did not do with my mention of the word. So maybe Marcas is affiliated.
@tom: Seems like i found an unintended feature on these boards - every time some one mentions "one" the word as in Marcas's post above - its putting in a subscription link for OptionnetExplorer. For a second i wondered if Marcas was affiliated with them.
ps: hmm.. and it did not do with my mention of the word. So maybe Marcas is affiliated.
So maybe Marcas is affiliated.

No, I'm not. I'd say quite opposite. I see ONE as a drag in my trading (not talking price) , but also see how traders may like it.
I did used ONE for couple years though.
Paul Demers had a presentation about excel and how to use RTD in one of the round table presentation and I vaguely remember a graph but that may have been a different video
The only one I know that worked with excel a did a graph was Bruno Voisin but he was using the data from IB He said he was planing to do one with TOS but he did not get around to do it yet
gariki
Member
Hear you Marcas. Same here actually; that's quite a coincidence. I used it for a couple of years - but now it's more of a drag than help.
No, I'm not. I'd say quite opposite. I see ONE as a drag in my trading (not talking price) , but also see how traders may like it.
I did used ONE for couple years though.
If I have to do more backtesting sometime in the future; I will get a subscription though.
Chuck Moore
Member
I reported this issue to TOS on Monday and they opened a ticket. I followed up this morning and they have the ticket in the que and expect to have it fixed in the next couple of days. It supposedly stems from some changes to update the T+0 line more frequently. If you have a winged strategy on you'll notice that in addition to the round, smooth graph, if you hover over the left side where it's flat to check the margin, the value changes and doesn't stay at the value it should be at expiration.
I wonder if this started recently when tom wanted to add advertising to the site
I know that is supposed to be for non members but maybe somehow the advertising got latched to that word and now it is spreading over all the threads regardless of the membership
gariki, i have a risk graph with p/l calculations in excel. it heavily depends on vba, but i think it's possible to do it w/o software. it would be messy, though. my spreadsheet was designed for a specific trade, not a general analysis tool. if you want to talk about how i did it, start a private conversation with me.ps: must confess. I did try a bit to get pnl charts into excel but its not trivial (yeah..i know nothing comes easy but still).
Jim, I would be interested in how you did the risk graph in excel, but don't know how to do a private conversation in this forum.gariki, i have a risk graph with p/l calculations in excel. it heavily depends on vba, but i think it's possible to do it w/o software. it would be messy, though. my spreadsheet was designed for a specific trade, not a general analysis tool. if you want to talk about how i did it, start a private conversation with me.
When you are logged in if you click on the mail icon on the top right corner you will have a pop up window where you can click on a link that says "Start a conversation"but don't know how to do a private conversation in this forum