TOS Thinkscript Question

JerseyJIm

Member
Gold Member
Starting to play around with TOS Thinkscript. How would I create something that would take say a 1 period ATR as a % of a moving average of the underlying price.

Looking to take ATR relative to the underlying value and was thinking that I could do it by just dividing one by the other, but that does not seem to work. The following is the script that the condition wizard created.

plot Data = ATR("length" = 2) / SimpleMovingAvg("length" = 4)."SMA";
 
Maybe something like this
declare lower;

input length=2;

input length1=4;

plot Average=ATR(length);

plot SMA1=ATR(length1);

This will give you 2 lines otherwise if you divide it it's just 1 line Not sure how useful that would be
 
Maybe something like this
declare lower;

input length=2;

input length1=4;

plot Average=ATR(length);

plot SMA1=ATR(length1);

This will give you 2 lines otherwise if you divide it it's just 1 line Not sure how useful that would be
Thanks for the help. After looking at what you provided and what #SergB provided, I came up with the following, which seems to be it. I have a lot of learning to go regarding Thinkscript.


I want something that on a one month chart, will take the ATR for that month as a % of the price for that month. Plan to use it as a general guide to when I might not want to do a hedged IC that I have been doing for many years (it is a wide IC with shorts at about 10 delta, hedged by a pair of wide debit spreads, giving an expiration shape like cat ears. I heard about the trade years ago, the guy who showed it to me attributed it to a guy named Bhavsar, who I think was a member of the Sheridan community). If the ATR at a % of price is trending at more than 10%, I may start avoiding the trade, as it requires too much management.

declare lower;
input length=1;
plot Ratio=ATR(length)/HL2;

It has been trending above 10% a month for just about all of 2022.

My next task is to figure out how to change the color, red if it is above 10% and green if it is below 10%
 
Last edited:
Thanks for the help. After looking at what you provided and what #SergB provided, I came up with the following, which seems to be it. I have a lot of learning to go regarding Thinkscript.


I want something that on a one month chart, will take the ATR for that month as a % of the price for that month. Plan to use it as a general guide to when I might not want to do a hedged IC that I have been doing for many years (it is a wide IC with shorts at about 10 delta, hedged by a pair of wide debit spreads, giving an expiration shape like cat ears. I heard about the trade years ago, the guy who showed it to me attributed it to a guy named Bhavsar, who I think was a member of the Sheridan community). If the ATR at a % of price is trending at more than 10%, I may start avoiding the trade, as it requires too much management.

declare lower;
input length=1;
plot Ratio=ATR(length)/HL2;

It has been trending above 10% a month for just about all of 2022.

My next task is to figure out how to change the color, red if it is above 10% and green if it is below 10%
Added the following and got the color change I wanted:

declare lower;
input length=1;
plot Ratio=ATR(length)/HL2;
Ratio.AssignValueColor(if Ratio<=.1 then Color.Green else Color.Red);
 
Not sure how is this supposed to work
I only see a choppy green line no red on SPX maybe it works better on other underlying
 
Not sure how is this supposed to work
I only see a choppy green line no red on SPX maybe it works better on other underlying

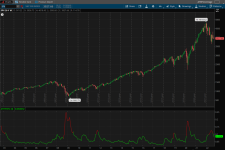
It seems to work as per the below. While I will use it on a few other symbols, I have been working on it using SPX.

1664667927991.png
 
I found the problem I was looking at the daily chart
It's working now although the graph does not look exactly the same Maybe you changed the length or something else Using it with the length of one is still quite choppy compared to yours
I have red from Dec to JUl with a small green down and than back to red at the same red level around 0.13
 
I found the problem I was looking at the daily chart
It's working now although the graph does not look exactly the same Maybe you changed the length or something else Using it with the length of one is still quite choppy compared to yours
I have red from Dec to JUl with a small green down and than back to red at the same red level around 0.13
I think I made it two. I am playing around with 1, 2 and 3. The trade duration is about 60 DTE at entry, so am thinking I will monitor it with 2, but will look at the 1 and 3 to see how those trends compare. I want this to be one of the general weather condition metrics I monitor as I enter my longer term trades each month.

If you extend the chart back to maximum, you can see way back into the 1930's. The chart seems to work well back then as well.
 
Looks like it's closer to 3 although the last bit is not the same I don't have the green part going down and yours is missing the last bit of red going up Maybe you took the screenshot before this big leg down in Sep
Here is how mine looks with length of 3
 

Attachments

  • Length 3.PNG
    Length 3.PNG
    26.9 KB · Views: 1
Looks like it's closer to 3 although the last bit is not the same I don't have the green part going down and yours is missing the last bit of red going up Maybe you took the screenshot before this big leg down in Sep
Here is how mine looks with length of 3
I also think I might have been in Ondemand when I took the screenshot.
 
Top
Contact Us
