volatility prediction (using the "lick then raise your index finger" method)

garyw

Active member
Gold Member
While I try to steer clear of predicting anything, sometimes it seems wise to observe what the money is betting on, then consider allowing that to weigh your decisions. For volatility, (IMHO) it seems foolish to me to attempt to predict unknown events, however it may not be foolish to consider what the market is actually saying (by price and implied volatility). I am beginning to look into using temporal IV for expected IV changes, and am curious if anyone is aware of good articles/white papers on the topic?
Note: similar to using VX term structure, for VIX, but more focused.
An inferred question: Can temporal Implied Volatility (say ATM IV of each expiry) aid in predicting if the IV of that term will increase or decrease with a time step? (Seems very logical and intuitive to me). (AKA reference IV slope at that point with respect to time)

PS: I do not expect above to be as useful for terms < 24 or so days... my interest is in terms greater than 24 DTE. (Low hanging fruit first)
 
Last edited:
i don't know of any articles on that topic but i can describe something i've been working on,
off and on, (mostly off) for a while. i'm attempting to curve fit the vol skew and then model the equations as time progresses. i'm not attempting to predict future vol skew, only model "normal"
and exaggerated skew based on price and time changes. once i have the equations i can apply
"what if" changes to the volatility and have it reflected on the t+n risk profile.

i have a program that captures the vol across various prices and eventually transmit the data
to a server to use as empirical data to generate the equation of the fitted curve. one problem
i'm running into is the vol skew curve doesn't map neatly into a quadratic or cubic equation.
large portions of the skew appears mostly linear. the model will have to piece together a linear
and quadratic equation to more accurately model the skew.

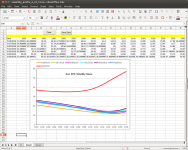
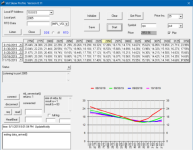
the below picture is the vol skew of spx captured today for various expirations.


spx_skew_aug1_2019.png


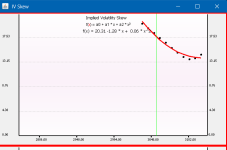
i extracted the iv from aug 30 expiration into my curve fit program and generated a
quadratic equation based on the least squares fit. you can see it doesn't map well to the
entire price range. my algorithm needs lots more work. ignore the x axis scale, the dots
represent spx iv at prices between 2850 and 3100 in 25 point increments.

i'd be interested in your thoughts on whether this is a waste of time or might have some
potential. in the mean-time i'm having "fun" relearning matrix math.


spx_aug30_skew.png
 
Jim:
Seems you have spent some effort coding, and unlike myself, have GUI expertise. Your post considers spatial rather than temporal IV relationship. For spacial, I take a slightly different approach, as IMHO, the implied volatility surface seems pure and in no need of filtering or tweaking. The IV of every point (within the accuracy range I desire) seems adequately precise. (except for very near terms {0 - 5 days for example}). -- Fitting to an equation will introduce error, which is unnecessary IMO. (My current stance, which is subject to change)
For me to get a better handle/understanding of IV, I take the approach of isolating IV from factors that can "cloud" and include factors that can hide what is really happening with IV. For example, the price of the underlying can change AND time can change, both of these heavily influence the "chart" of typical IV curves (or Surface). By plotting with underlying price and time impact removed, we get a much "clearer" view of IV. To remove impact of underlying price, you may plot X axis by moneyness instead of underlying price. To remove the impact of time (when plotting surface with multiple DTEs together), I stumbled across a formula that I have used for a few years that does the trick for me (else slope of each DTE IV increases as DTE decreases, which is only due to the time impact). -- Your 4 skew plots would likely be parallel to each other if plotted the way I stated, with the vertical offset being due to the term contango (term contango of zero should imply the curves would be almost identical/overlay each other).

Back to what I am scratching my head on.... with IV change (with respect to time) I will add another post (hopefully this weekend) that may be more clear -- Stating clearly and concisely is easier said than done. (If I state it correctly, the response from everyone should be" DUH, well of course", rather than some earth shattering insight.)
 
i'd be interested in your thoughts on whether this is a waste of time or might have some
potential. in the mean-time i'm having "fun" relearning matrix math.
View attachment 2104

Jim, my experience with fitting IV into equation(s) is close to none. Gary's knowledge is much greater.

I understand having fun with math experimentation and from this point of view this is hobby like any other (unless you are academic, then it is your job).
From trader's point of view... I think it is waste of time (I'm talking about modeling, not about understanding IV).
 
gary, my goal isn't to produce a vol surface, the goal is to create the iv curve for tomorrow. in my skew plots
above, they are all plotted with the same moneyness. the only difference is time to expiration. i've captured
the iv skew for several days leading up to, and the day after the brexit vote in 2016 in the below graphic.
(ignore the label, this is the july expiration, not december)

i posted these years ago in a capital discussions forum, i think. these samples aren't normalized for moneyness,
but if they were, with the exception of the day after the brexit vote, they would likely be parallel as you stated.
the 23rd of june was a somewhat large 27.87 point up move, the 24th was a 75 point down move. this would not
be parallel if adjusted for moneyness. what i want to do is model the equation of a "normal" or abnormal day's move, either up or down, and apply that to the risk graph for tomorrow. clearly, figuring out how the equation
changes is the challenge. i don't know what kind of accuracy you're looking for but there are way too many
moving parts to expect an "accurate" model. it's easy to shift a curve up or down, it's the tilt that becomes
more of a problem.

spx_iv_brexit.png

one other comment, all my graphs and calculations are based on thinkorswim's iv calcualtions
being accurate, which they aren't.
 
Last edited:
Jim: My goal (relating to the post) is not really "predicting what" the IV will be tomorrow, but whether my "assumptions for what I expect IV to be tomorrow" should be discounted due to "abnormal" term volatility.
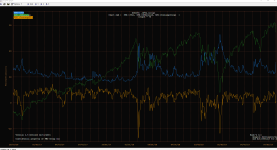
I still don't have a good way to express and obtain takeaways yet, but, below is possible start:
On the plot, there is
1) Green plot of a scaled SPX for timing reference
2) Blue plot of ATM Implied Volatility looking out 70 Calendar days.
3) Orange plot of ATM IV Contango slope at 70 DTE. Note: This uses 24 DTE as the lower point for computing the Contango slope to reduce noise and possible false signals. The value is just the slope multiplied by 10,000 to produce the displayed plot. {Note the zero crossings).
I am considering some level of this Contango slope as a "time to get out of the kitchen" signal. (For a 70 DTE premium selling type of strategy)

1564939197246.png
 

Attachments

  • 1564939069749.png
    1564939069749.png
    1.1 MB · Views: 3
Last edited:
Jim: You may wish to check out Bruno's Options Mechanics Trading Group - Join the group at https://aeromir.com/optionsmechanics
If you have not already done so. While I think the IV surface is best approximation of what will occur "next" barring some unexpected disruptive event, I actually prefer to use "sticky strike", where I understand the error in my projections (Jim Riggio's "bent handlebars" statement applies) until I get a better replacement. {testing other options is very error-prone and non-trivial to validate IMO}
 
From trader's point of view... I think it is waste of time (I'm talking about modeling, not about understanding IV).
marcas, i think it's important to model some sort of iv change, just to see how your position responds
to changes. the model may not be accurate but you know if the market moves down the iv will
increase some. this is especially true when trading calendars or diagonals. using past history
you can get some idea how iv changes. granted, every situation is different but at a high level
it will be similar.
 
A model will never be able to predict what will happen in the future. It can tell you that based on the past this will change if that happens but the past never quite repeats itself exactly. The question then becomes is it better to say "good enough" with the model and use that time instead to study the past and see what were the conditions before, during and after each volatility event such as Brexit, February 2018, December 2019 etc. and how volatility and skew actually behaved?
 
marcas, i think it's important to model some sort of iv change, just to see how your position responds
to changes.

Absolutely. This regards second part from the quote above.
Re first part: In my humble opinion the best sort of model" is the one built in your head, sometimes it is called experience. Works much better than computer one.
(Sorry for that. I think this was a way to expresses what I want to say in shortest amount of words.)

Back to second. What I did in my past, was that I reversed the process you described. I started from designing smile curve with, as you said, combination of linear and exponential equations (to model curvature). I entered sliders to the code for easy adjusting parameters. It was very simple thing. You controlled IV level at ATM, then slope in each direction independently (put, call), and then you add concavity/convexity on top of that. You also can think of adding another parameter to slide this convexity along the smile if you want, or even add second, independently controlled curvature etc. I thought it was unecessary for what I wanted.
With this parameters, via sliders, you created VolSkew (VS)you wanted and then produced options chain out of it.
Then you coded in your trade in desired place and played with sliders and observed how trade responded to changes in VS shape.
I went more fancy, I created 2 VSs. One for entry time and one for exit time and plotted multiple t lines, to observe changes over time in one glance.
What I was also thinking of doing, but never did, was to simply test trades in real environments by adopting live VSs from crash times. I just didn't think benefits would be worth the effort.

So, yes, you can model VS to see how your structure responses without sweat and frustration connected to any attempt to model 'real' VS.
I don't insist that my way is the best, or even that it is good. Let's say: it was good enough for me. This is how i approached this problem few years ago. Today I think it that even that was overkill - I had more fun coding than anything else. What helped me to understand VS better was thinking about it not observing changes in t-lines.

I agree with what Andrew S said. There is big misconception out there that models help you predict future somehow. They don't, no matter how fancy they are.
 
relating to Jim's and Marcas's posts::
IMHO: Regarding option evaluation (modeling, dissecting, etc), it is my opinion that traders of options for "income" (AKA predominately premium sellers), are doing so to capitalize on the historic imbalance of Implied Volatility VS Realized Volatility. Sense this is an exploitable "edge"; market forces will continue to reduce this imbalance. That being the case, any evaluations of this area need to minimize error, as the contribution of the error in your equations will be magnified as the "imbalance" is reduced. At some future date (years?), this will cease being a profitable area for retail traders.
I strive to insure calculations/evaluations truthfully express what IS or what WAS, as all needed data is available to do so. Many begin "predicting/guessing/etc" without establishing a solid reference of what IS.
If one makes error in their understanding early (and bases subsequent decisions on it), no amount of "spackle", molding, or other curve fitting will do justice in reversing the impact of the error! -- Garbage In - Garbage Out.
Also, the approach one takes should relate to what their goals are! If you are planing to trade for the next year, then many things are "close enough" and you may not need to worry about details. However, if you are seeking to understand and remain precise/accurate into the future, you may want to consider keeping all error sources minimized (not a trivial task).
Note that even "Expected Move" should not be considered a "prediction", but merely a projection based on statistical data inferences.
I am NOT an expert, but merely try to make sure things continue to "pass the smell test".
 
While I try to steer clear of predicting anything, sometimes it seems wise to observe what the money is betting on, then consider allowing that to weigh your decisions. For volatility, (IMHO) it seems foolish to me to attempt to predict unknown events, however it may not be foolish to consider what the market is actually saying (by price and implied volatility). I am beginning to look into using temporal IV for expected IV changes, and am curious if anyone is aware of good articles/white papers on the topic?
Note: similar to using VX term structure, for VIX, but more focused.
An inferred question: Can temporal Implied Volatility (say ATM IV of each expiry) aid in predicting if the IV of that term will increase or decrease with a time step? (Seems very logical and intuitive to me). (AKA reference IV slope at that point with respect to time)

PS: I do not expect above to be as useful for terms < 24 or so days... my interest is in terms greater than 24 DTE. (Low hanging fruit first)
Hi Gary....there is this research paper from a while back...it still seems to work more often than not: https://caia.org/sites/default/files/forecasting_a_volatility_tsunami.pdf
 
Hi Gary....there is this research paper from a while back...it still seems to work more often than not: https://caia.org/sites/default/files/forecasting_a_volatility_tsunami.pdf
Thanks Donald.

Interesting article. I really appreciate the reference!
If this is of interest to anyone, I wrote a simple TOS ThinkScript to approximate his "Chart 9", which triggers a signal when the VIX std dev < 0.86 AND the VVIX std dev < 3.16, and places an "up arrow" at the close of whatever you are Charting on daily bars. I agree with you that in the past it seems to work more often than not, but I feel uncomfortable calling this a forecast signal. (Note that it FAILED to fire in 2018 with the 3 big vol events!) --
With this simple study, the references to VIX and VVIX are embedded in the script, so you can use with other security selections, such as SPX. (Delete the redundant .txt extension, before loading into TOS)

Chart #5 is excellent! However, IMHO, there is no "predictability" value here with the possible exception of volatility reduction (if relatively high).

PS: Note, since VVIX on TOS only begins in 2012, the study is not useful prior to that time.

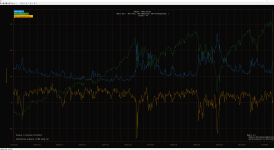
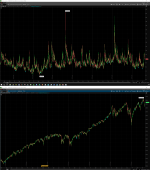
A view of this study with SPX and VVIX (arrow signals from same script).
1565303650531.png

Does not appear predictive to me.
 

Attachments

Last edited:
Top
Contact Us