Calculating option profits

Cellsee6

New member
I am looking for some tool to use to calculate trade profits. I have tried searching various forums but it seems I don't know what search words to use.
When I export the data from Thinkorswim for an option trade the data in the csv file is convoluted and difficult to use.

I would like to know what folks in Aeromir use to calculate the profits for a trade. This must have been discussed many times.
Perhaps someone could point me to the posts where this has been discussed?

Thank you for your help.
 
It looks like you asked this question a few times in the past
I used to download the trades and rearrange the data in a way that made sense to me but after Tom created the day trading spreadsheet that is much better
Unfortunately I am not sure if that is still available as the newer spreadsheet is made mostly for entering and adjusting trades
You have to enter the opra code and the filled price and the rest would be automatically calculated
It's a lot easier than trying to straighten out the downloaded data
 
I am looking for some tool to use to calculate trade profits.
Hi. The best toots to trace profits in many cases are pen and paper.

There are situations that you may need smth else for example if you do HFTrading, or trade a lot or trade many many different underlying.
Other case is if you are lazy. I suspect I'm the later and I managed developed a tool that does it automatically for me - no manual entries, just 'one click' - so it is possible - but it's a lot of work.... ;) (If you want to ask - my tool is personalized and not for sharing).
Anyway, pen and paper method is very good. Just try it. Next to it is simple spreadsheet but, in my opinion, its far behind.

Ofc:it all depends".
Can't direct you to any 'all scenarios' tool.
 
I do this by spreadsheet.

At its essence, P&L is the summation of all of your option positions' current price less or plus what you entered at. Your total P&L decomposes into each of those trades, keeping the closed trades in that total.

Depending on your brokerage, you might be able to use live prices for your open positions that will update in realtime in your spreadsheet.
 
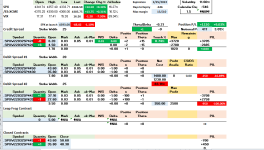
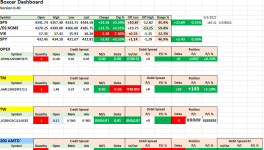
I am using the boxcar-tool spreadsheet that Tom created It has a monitor tab of which I made several copies one for each account or brokerage and it also has the dashboard which I also edited so I can look at all the accounts in one sheet at a glance and they all run live with RTD

More recently I customized one of the tabs to work with /ZB futures because of the way the price is displayed in TOS not in decimals but in fractions using 1 or 2 single quotes and it all runs well
 
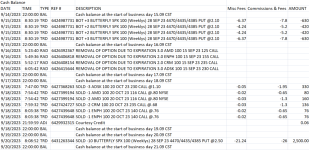
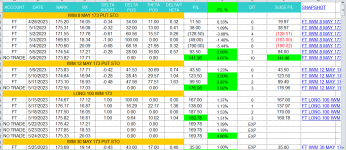
This is a portion of a spreadsheet I created. I export data from TOS. Under the Monitor | Account Statement tab, on the far right side of the Acct Statement row there is a "3 line button". Click on the button and a dialog box appears. The 2nd row from the bottom says "Export to File..." Click that option and a dialog box appears that gives a suggested file name starting with the current date ( 2023-XX-XX-AccountStatement.csv). I will generally accept the suggested option with minor additions to the end of the suggested name (ie - account name). Select the folder that you want to save the file in and select "Save". Open the exported file by double-clicking it (it should open automatically in Excel) and at the top of the csv file will be a line including the account number and name along with the dates included in the file. (you can choose to export up to 370 days at a time)
Data exported from TOS:

1695356142696.png


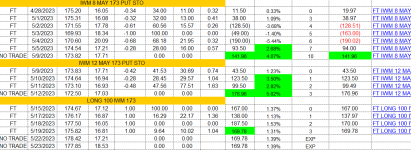
Select the data you want to analyze and use Ctl-C to copy the data. Go to you newly created record file (see below) and paste the data (Ctl-V). You can easily delete rows of data you don't want (days when no trades have occurred). I will manually group (copy and paste) all trades belonging to the same trade sequence. I have manually created the top row shown below. The next 2 rows are copied and pasted from TOS. All data shown on those rows are exactly as supplied by TOS (dates are formatted how I like them). Summing up the fees / commissions / amount in each column for every opening / adjusting / closing trade and then summing those up in the bottom row cell on the far right gives the exact PnL of a completed trade sequence from opening to closure or expiration. I've been using this spreadsheet for years and simply copy and paste to it each time I start a new trade so I don't have to recreate formulas every time I start.

My spreadsheet:

1695354826277.png

You need to be careful to avoid mixing trades / adjustments from different trade sequences / strategies if you're using the same underlying vehicle for different strategies. Also, I try to make sure that any time I open / adjust / close a trade I immediately export the data and copy/paste it into my spreadsheet so I don't have to spend time figuring out how to group various trades.

This procedure may initially sound complicated but once you get into the habit of exporting all trades on the day they are executed it becomes a fairly quick procedure and it gives an exact PnL for every trade you perform. (Note: TOS will occasionally post small credits to you account for trades PnL's that can't be calculated to the exact penny.)


That's good but it's limited to TOS
With the boxcar spreadsheet that TOM created you could track the p/l of many other brokerages and it's less complicated
 
status1 - could you share a screenshot of how your doing that? You mentioned you have made some of your own mod's.
 
Here are a few screenshots of the one I am using one is the monitor tab that's where you enter the data for the individual brokerage and the dashboard tab is where it's all collected in one page Than I have a separate workbook where I transfer each line using a macro to lock in the EOD prices and also take a snapshot of the risk graph for that day

Unfortunately my motherboard on my pc I believe failed a couple of days ago so I am currently in the process of rebuilding it not from scratch because I have a an older copy I got from my laptop so I have to make up the calculations for the /ZB but for the most part it's all there
 

Attachments

  • Monitor tab.PNG
    Monitor tab.PNG
    44.8 KB · Views: 11
  • Dasboard tab.PNG
    Dasboard tab.PNG
    55.1 KB · Views: 11
  • PandL Tracker.PNG
    PandL Tracker.PNG
    71.3 KB · Views: 11
Neil, So I am able to export the data out of TOS. But on the other spreadsheet, how do you get it to calculate the ROI and P/L? Are you doing that manually or do you have some sort of formula in your spreadsheet? Thanks.
 
This is a portion of a spreadsheet I created. I export data from TOS. Under the Monitor | Account Statement tab, on the far right side of the Acct Statement row there is a "3 line button". Click on the button and a dialog box appears. The 2nd row from the bottom says "Export to File..." Click that option and a dialog box appears that gives a suggested file name starting with the current date ( 2023-XX-XX-AccountStatement.csv). I will generally accept the suggested option with minor additions to the end of the suggested name (ie - account name). Select the folder that you want to save the file in and select "Save". Open the exported file by double-clicking it (it should open automatically in Excel) and at the top of the csv file will be a line including the account number and name along with the dates included in the file. (you can choose to export up to 370 days at a time)
Data exported from TOS:

View attachment 4729


Select the data you want to analyze and use Ctl-C to copy the data. Go to you newly created record file (see below) and paste the data (Ctl-V). You can easily delete rows of data you don't want (days when no trades have occurred). I will manually group (copy and paste) all trades belonging to the same trade sequence. I have manually created the top row shown below. The next 2 rows are copied and pasted from TOS. All data shown on those rows are exactly as supplied by TOS (dates are formatted how I like them). Summing up the fees / commissions / amount in each column for every opening / adjusting / closing trade and then summing those up in the bottom row cell on the far right gives the exact PnL of a completed trade sequence from opening to closure or expiration. I've been using this spreadsheet for years and simply copy and paste to it each time I start a new trade so I don't have to recreate formulas every time I start.

My spreadsheet:

View attachment 4728

You need to be careful to avoid mixing trades / adjustments from different trade sequences / strategies if you're using the same underlying vehicle for different strategies. Also, I try to make sure that any time I open / adjust / close a trade I immediately export the data and copy/paste it into my spreadsheet so I don't have to spend time figuring out how to group various trades.

This procedure may initially sound complicated but once you get into the habit of exporting all trades on the day they are executed it becomes a fairly quick procedure and it gives an exact PnL for every trade you perform. (Note: TOS will occasionally post small credits to you account for trades PnL's that can't be calculated to the exact penny.)


Neil, I typed in a question below but here it is again. I am able to export out of TOS. But how do you calculate ROI and P/L? Is it a formula of yours? Or is there something from the exported file that I am missing? Thanks.
 
I just realized I sent one of the screenshots without the column titles so the numbers are kind of meaningless without it
Here is another screenshot with the column titles
 

Attachments

  • Column titles.PNG
    Column titles.PNG
    94.4 KB · Views: 9
Neil, I typed in a question below but here it is again. I am able to export out of TOS. But how do you calculate ROI and P/L? Is it a formula of yours? Or is there something from the exported file that I am missing? Thanks.
I calculate the values of ROI & P/L with equations I have created in the spreadsheet. To calculate ROI I either calculate the margin required for the trade I'm doing or I utilize the margin that TOS charges me. You can calculate the margin requirements of vertical spreads / butterflys, / condors in a pretty straight forward manner yourself (calculate the margin required on both the upside and downside legs of a trade and utilize the largest margin required to calculate the ROI, which is equal to (PnL of trade divided by largest calculated margin requirement). Remember, margins in a trade can vary if adjustments are made during the trade and you need to use the largest margin required during the trade to calculate an accurate ROI. If you need help with that I can show you some formulas I've created to calculate those numbers in Excel. For Calendars I use what TOS charges me (but since I typically buy calendars the maximum loss I face with a calendar is equal to the cost of buying the calendar * the number of lots * 100). ROI is simply the profit or loss (bottom right cell of spreadsheet) on a completed trade divided by the max margin used in the trade (middle cell of top row). P/L is calculated using the spreadsheet as I've described in my original post. The bottom right cell in the spreadsheet is the P/L of the trade after all trades (open/adjust/close) are exported from TOS and pasted into the spreadsheet.
 
Top
Contact Us