
You are using an out of date browser. It may not display this or other websites correctly.
You should upgrade or use an alternative browser.
You should upgrade or use an alternative browser.
ATM Weekly Options Strategy Trade Alerts General Discussion
- Thread starter Tb2018
- Start date
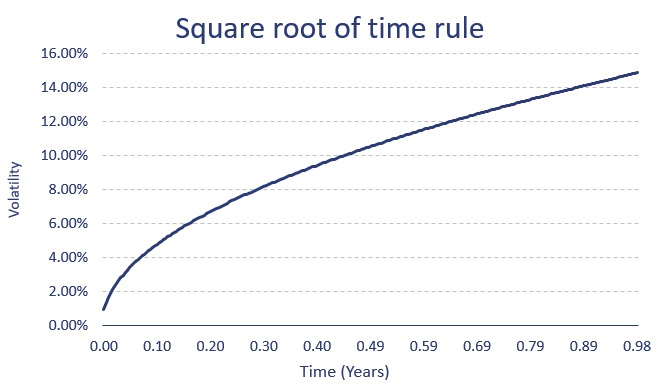
Square Root of Time Rule and its implications for comparing different term structures and skews.

 12
12
 breakingdownfinance.com
- Square Root of Time Rule:
- The Square Root of Time Rule suggests that the volatility of a financial asset or portfolio should be scaled by the square root of the length of the investment horizon.
- This rule applies to various contexts, including options pricing and risk assessment.
- The length of the investment horizon can be measured in days, months, or years.
- Implied Volatility and Term Structures:
- Implied volatility refers to the market’s expectation of future price fluctuations for an asset, as implied by option prices.
- When implied volatility changes, the change in at-the-money (ATM) volatility multiplied by the square root of time remains relatively constant.
- This means that different term structures (e.g., comparing volatility across different maturities) can be compared using a normalized approach.
- Comparing Term Structures:
- Consider two term structures with maturities T1 and T2, where T2 > T1.
- To compare them, we normalize the volatility by multiplying it by the square root of the ratio of T2 to T1:
- Normalized volatility = Volatility × √(T2 / T1)
- By doing this, we account for the different time horizons and make the comparison meaningful.
- Skew and Calendar Trades:
- Skew refers to the asymmetry in implied volatility across different strike prices.
- When normalized by the appropriate weighting (using the square root of time), we can identify calendar and skew trades:
- Calendar trades: Exploiting differences in implied volatility across different expiries.
- Skew trades: Capitalizing on skew variations across strike prices.
- Analyzing term structures and skew in this way helps us determine attractive buying or selling opportunities.
12
Square Root of Time Rule - Definition and Excel Implementation...
The square root of time rule is a simple heuristic used in finance to scale the volatility of portfolios from one frequency to another...
breakingdownfinance.com
Nice performance of the service.
> [square root of time] making it a valuable tool for risk management and trading strategies.
Only in theory.
SqRT can be (in theory) used to evaluate trades. Don't know how to use it in risk management. I think methodology here can be very vogue.
Do you use it on daily basis or know anybody who uses SqRT in trading. I assume it may be used by big fund firms to balance portfolios but for retail traders it's, imo, just a curiosity. A thing in 'good to know' category, maybe to pay with a little but of no practical use in regular trading.
What do you think?

> [square root of time] making it a valuable tool for risk management and trading strategies.
Only in theory.
SqRT can be (in theory) used to evaluate trades. Don't know how to use it in risk management. I think methodology here can be very vogue.
Do you use it on daily basis or know anybody who uses SqRT in trading. I assume it may be used by big fund firms to balance portfolios but for retail traders it's, imo, just a curiosity. A thing in 'good to know' category, maybe to pay with a little but of no practical use in regular trading.
What do you think?
I'm toking strictly about using SqRT.
Can you tell how do you use it when trading calendars? I do not try to extract any secrets of you - if your method is be propriety - I respect that but then it falls into 'black box' category.
Problem with SqRT (and others) is that it requites good, or at least very consistent, IV. This is very hard to do. Hard, in meaning of workload. Once you go over hurdle of working out formulas, it boils down to getting correct inputs - this is not an easy-pizzy task.
IV from TOS (and other brokers) is known to be rather inaccurate and even inconsistent within itself (I argue that they are pretty good, but I have high tolerance level in this matter. Was testing TOS's data a whgile ago and didn't check if Schwab introduced any changes, but TOS numbers were ok for how I use them). IV is maybe not so important on long term trades; in short terms, on the other hand, it's extremely important, the shorter dte the more important accurate IV is - that is if you rely in your trading on IV/SqRT alone.
My suspicion is that you do SqTR calculations but in reality trading decisions on smth else.
Re 252/365 days. I'm of opinion (a strong one) that neither is correct. You have to include closed market days in calcs but not as eqal to trading days. I was about creating formula for that once, but gave up when realizing how many inputs are needed to be taken into consideration.
We had small discussion recently about the same topic and someone (Gary ) mention that CBOE started using smth similar ('in between' number for days for IV) in their formulas. I did not checked on that yet (IV is not so important for me anymore).
So, if this is of any value, right of the bat by using 252 or 365 you may have wrong inputs (this one is not quite important on short dtes though).
So.. I still think that SqRT is useful but mostly in theory, in academic approach to trading. For live trading it does not provide much (any) practical value.
What do you say?
Can you tell how do you use it when trading calendars? I do not try to extract any secrets of you - if your method is be propriety - I respect that but then it falls into 'black box' category.
Problem with SqRT (and others) is that it requites good, or at least very consistent, IV. This is very hard to do. Hard, in meaning of workload. Once you go over hurdle of working out formulas, it boils down to getting correct inputs - this is not an easy-pizzy task.
IV from TOS (and other brokers) is known to be rather inaccurate and even inconsistent within itself (I argue that they are pretty good, but I have high tolerance level in this matter. Was testing TOS's data a whgile ago and didn't check if Schwab introduced any changes, but TOS numbers were ok for how I use them). IV is maybe not so important on long term trades; in short terms, on the other hand, it's extremely important, the shorter dte the more important accurate IV is - that is if you rely in your trading on IV/SqRT alone.
My suspicion is that you do SqTR calculations but in reality trading decisions on smth else.
Re 252/365 days. I'm of opinion (a strong one) that neither is correct. You have to include closed market days in calcs but not as eqal to trading days. I was about creating formula for that once, but gave up when realizing how many inputs are needed to be taken into consideration.
We had small discussion recently about the same topic and someone (Gary
) mention that CBOE started using smth similar ('in between' number for days for IV) in their formulas. I did not checked on that yet (IV is not so important for me anymore).So, if this is of any value, right of the bat by using 252 or 365 you may have wrong inputs (this one is not quite important on short dtes though).
So.. I still think that SqRT is useful but mostly in theory, in academic approach to trading. For live trading it does not provide much (any) practical value.
What do you say?
Last edited:
Re ' in between' number. I dont mean some number between 252 and 365. It's a number between 0 and 1 for off-market days, where 0 results in 252 and 1 in 365. So this is some ratio, but ratio is not constant and depends mainly on IV levels and dets (and other stuff but usually of lesser importance). I'm mostly speculating here as I abondoned this project early on.
If it's mambling to you... it pobably is...
If it's mambling to you... it pobably is...
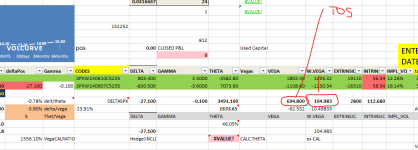
t's keep it short/ This is from a Tool that I created and presented in Aeromir...In this example you see A Long Calendar 7-10 JUN.You have tos Vega /and Calc.W.Vega ....A big difference for 10 Lots!I'm toking strictly about using SqRT.
Can you tell how do you use it when trading calendars? I do not try to extract any secrets of you - if your method is be propriety - I respect that but then it falls into 'black box' category.
Problem with SqRT (and others) is that it requites good, or at least very consistent, IV. This is very hard to do. Hard, in meaning of workload. Once you go over hurdle of working out formulas, it boils down to getting correct inputs - this is not an easy-pizzy task.
IV from TOS (and other brokers) is known to be rather inaccurate and even inconsistent within itself (I argue that they are pretty good, but I have high tolerance level in this matter. Was testing TOS's data a whgile ago and didn't check if Schwab introduced any changes, but TOS numbers were ok for how I use them). IV is maybe not so important on long term trades; in short terms, on the other hand, it's extremely important, the shorter dte the more important accurate IV is - that is if you rely in your trading on IV/SqRT alone.
My suspicion is that you do SqTR calculations but in reality trading decisions on smth else.
Re 252/365 days. I'm of opinion (a strong one) that neither is correct. You have to include closed market days in calcs but not as eqal to trading days. I was about creating formula for that once, but gave up when realizing how many inputs are needed to be taken into consideration.
We had small discussion recently about the same topic and someone (Gary
So, if this is of any value, right of the bat by using 252 or 365 you may have wrong inputs (this one is not quite important on short dtes though).
So.. I still think that SqRT is useful but mostly in theory, in academic approach to trading. For live trading it does not provide much (any) practical value.
What do you say?
Cheers
I suggest to look for the tool (OPTINSMATRIX)(free to use for few Months!)try it and see if works for you!
Password :ATM2024
NOTE: It's feeding data from TOS ONLY!
Password :ATM2024
NOTE: It's feeding data from TOS ONLY!
Last edited:


OK we don't have to talk about SqRT. I just stick to what I've already concluded when investigating this topic. I know trades who did extensive work on that, including plotting cool 3D graphs, but I have not seen anybody successfully using SqRT concept in practical trading. Sure. it can be used to evaluate market conditions in, sort-off, objective manner but there are tools/methods that can do the same faster and more accurately.
Thanks for link to OPTINSMATRIX, Looks impressive. It is not for me though.
I see big difference on your pic in Vega. ( I'm familiar with weighted vega. I do not use weighted vega - beside metal adjustments, when I look at vega, which is very rare. I go mostly by 'general knowledge about trades not by exact value of any derivative metric. I did not say 'popular knowledge.'). Now, tell me why one of them (vegas fron your spreadsheet) is better than another. If you want to discuss vegas that is. For what I've researched: both numbers are wrong. I can be wrong on that off course,
Re last post. Traders should embrace the wheel, but also should pay attention if that wheel is attached to anything.
OK. maybe I was mislead by first post in this topic. Wanted to discuss some ideas. I know you are a good trader and this is the bottom line. I did see other veteran traders, highly successful, much better than I, who were using 'popular concepts' when teaching, concepts that are well established in 'retail trading community', still concepts that are often misunderstood. And what's kinda funny, when you know what to llok for, when observing them in action they don't use those concepts in practice, at least not directly. 'I trade solely by greeks' or 'by charts' - BS, I say. What counts is long term pl curve. and yours look good. It impresses me more than complicated spreadsheet
I'm open to discuss SqRT, vega or trading time spreads. I like to be proved wrong - if so, my pl line may improve. But I don't insist.
Also don't intend to interfere with service promotion ( we can talk elsewhere ). I did not look closely on material but pl graph looks really good. I also like the rule of service you posed. I just may add that trading with no fixed rules do require some understanding what you are doing and a ton of experience, Still much, much better (imo) than: 'when delta rise above 2.5 then put vertical spread 20 points below the market' type of managing trades. Actually I think it all comes down to preffered trading style. This comes with experience and is very hard to convey to unexperienced. ( I see myself somewhere in the middle and still want to learn. )
Thanks for link to OPTINSMATRIX, Looks impressive. It is not for me though.
I see big difference on your pic in Vega. ( I'm familiar with weighted vega. I do not use weighted vega - beside metal adjustments, when I look at vega, which is very rare. I go mostly by 'general knowledge about trades not by exact value of any derivative metric. I did not say 'popular knowledge.'). Now, tell me why one of them (vegas fron your spreadsheet) is better than another. If you want to discuss vegas that is. For what I've researched: both numbers are wrong. I can be wrong on that off course,
Re last post. Traders should embrace the wheel, but also should pay attention if that wheel is attached to anything.
OK. maybe I was mislead by first post in this topic. Wanted to discuss some ideas. I know you are a good trader and this is the bottom line. I did see other veteran traders, highly successful, much better than I, who were using 'popular concepts' when teaching, concepts that are well established in 'retail trading community', still concepts that are often misunderstood. And what's kinda funny, when you know what to llok for, when observing them in action they don't use those concepts in practice, at least not directly. 'I trade solely by greeks' or 'by charts' - BS, I say. What counts is long term pl curve. and yours look good. It impresses me more than complicated spreadsheet
I'm open to discuss SqRT, vega or trading time spreads. I like to be proved wrong - if so, my pl line may improve. But I don't insist.
Also don't intend to interfere with service promotion ( we can talk elsewhere ). I did not look closely on material but pl graph looks really good. I also like the rule of service you posed. I just may add that trading with no fixed rules do require some understanding what you are doing and a ton of experience, Still much, much better (imo) than: 'when delta rise above 2.5 then put vertical spread 20 points below the market' type of managing trades. Actually I think it all comes down to preffered trading style. This comes with experience and is very hard to convey to unexperienced. ( I see myself somewhere in the middle and still want to learn. )
Last edited:
Just follow the instructions (video and yellow notes)..WOW! That's a big excel file Looks complicated Not even sure how to use it
Thanks I think the unblock helped At least I got the right date and time to show up correctly which was not doing before not sure if that means the Goti is installed properly I guess you need everything to work in order to find out
I was trying to load TOS but looks like it's not working it's taking a long time I am guessing they are doing some maintenance on the weekend
I was trying to load TOS but looks like it's not working it's taking a long time I am guessing they are doing some maintenance on the weekend
I got TOS working today and the spreadsheet seems to be working now Just a small problem when I make a change it does not take effect until I close and reopen the spreadsheet but I think that is due to the version of excel that I have but I can deal with that
Not sure how to use it but at least it's working
Not sure how to use it but at least it's working