Calendar spreads

This one will be about using VIX for calendars (actually for all other option trades).
I'd' like to start with an analogy - with all caveats about analogies.

Imagine you enter a school with where students, say high-schoolers,, are divided between 10 classrooms.
Your task is to select a tall student. Reason is not important, you need him for basketball team or to change a light bulb in a hallway.
You are not necessary looking for the tallest one but for tall enough to do the job.
In your disposition, for reason we, again, don't care about, are name lists of students in each classroom and a list of average heights of students from each classroom (10 numbers). No heights of particular students.
You can open one of classroom doors and select a tall head, but you rather decide to select a random name from a classroom with the highest average.
A move not without some logic behind but, I hope you agree, not an optimal move.

The situation form above is somewhat similar to what happens when relaying on VIX during calendar selection. Actually it’s even worse because there is no list of averages averages for all classrooms (expiration cycles) but just for a single one (30 dte).

The point is that VIX alone does not provide enough info to make a good trading decision. There is no way to tell if selected calendar is a good choice or not. We can only tell about VIX itself.

Vix tells about average volatility at 30 dte cycle.
It is true that there is a connection between VIX and your calendar. There are are restrictions how much IV value can change with every step ypu move away from that 30 dte average (horizontally or vertically). But those variations accumulate with every step. The farther away you are fthe less relevant VIX value is for your trade.

In practice, many traders do use VIX, but only as just the first step in a process, not the final.
Say VIX is low -> we look for trades in group A (which typically has favorable entries in low vol) and skip over trades B. Then we do detailed inspection to find the best in group A.
This does not mean that all trades in group A are good and that there is no good trades in B, but statistically there is a better chance to find good candidate in A. It's a matter of efficiency, saving precious time.
If we consider trading only calendars we safely can skip the Vix part and go straight to "the meat".

If it helps...
You can think of volatility surface as a table cloth (or bed sheet) that is hold by four persons by the corners. People can move cloth corners up and down ( the ides is that each corner can move independently). If the cloth is fixed somewhere in the middle (like being nailed to some stick) then is is fixed only at this point (VIX spot) while other parts can still move up and down. The farther away from fixed point, the higher range of possible variations of elevation of a particular point on the cloth.
I'm not sure if this cleared or muddied the picture.

The point: although VIX brings some information about state of the cloth... volatility surface at 30 dte, it does not provide enough information about IV at the cycle we want to trade.

Ok. enough of that.

There is another more importatn reason that you should look at actual IV, relevant to your trade, and not VIX - in the next post.
 
I have shown (without live examples for now) that volatility in cycles we want to trade can be very different from what VIX tells. We should look closer. But even if we have Vix-style info for our particular cycles, like putting a calendar in 30 dte cycle, it still want be enough. We must look at individual strikes.

Calendars are combination of 2 strikes. The numbers corresponding directly to those strikes are important.
VIX matters little, skew doesn't matter, moon phase doesn't matter. Strikes values do matter.

Why? Why we should look at both strikes and not at some general volatility level?
It is because relations of those strikes (I think IV values) are essential in selecting calendars, and are only loosely tied to "general" volatility indicators.

In trading we want to buy low and sell high.
For calendar entry it means we want to sell short leg dear and buy long leg cheap.
IV surface is not a glass panel that moves up and down in parallel (extension of cloth analogy). If that was the case, VIX would be perfectly OK, but as vol. surface flexes up and down all the time, we should look at our particular strikes as principle modus operandi.
(You can use a calendar prices for the same purpose but this is bit more complex. If one trades a single calendar setup, say 10/9, all the time then using price can be more convenient, but price method requires more upfront research.)

About terminology I use - to avoid future confusion.
A terms "contango" and "backwardation" are used by futures traders to describe relationship of prices between different trading months.
They( those terms) are, to my knowledge, not formally connected to options but they are so convenient that I use then regardless (others I know do that to).

Contango - is a state where shorter dte strike (we are thinking calendars structure) has IV smaller than longer dte strike.

Backwardation is a situation where short dte has higher iv value then longer dte.

When I refer to vertical spreads I use term skew (shallow skew, steep skew, etc). When I refer to horizontal (time) spreads I use terms contango and backwardation (shallow contango, deep backwardation).

Important: options are not futures. IVs are not prices.
Not everything you read about contango from futures world applies to options world.
I use those terms only to indicate IV relationship - not prices.


So.... it is very simple. The deeper contango (the lower short IV value is in relation to long IV) in a calendar spread the worse calendar is. The bigger backwardation - the better.


This was a lot of words. Let's take a look at live example.

On 11 Nov 2024 Vix was about 15.
A calendar:
BUY +1 1/-1 CUSTOM SPX 100 (Weeklys) 03 DEC 24/02 DEC 24 6000/6000 CALL/CALL
was for sell at about $2.75 . It was an ATM calendar.

then on 14 Feb 2025 VIX was again at the same levels and ATM was also similar - at 6113
A calendar at about the same dtes was:
BUY +1 1/-1 CUSTOM SPX 100 (Weeklys) 07 MAR 25/06 MAR 25 6115/6115 CALL/CALL
and it was to buy for about $4.90

Same VIX - very different calendar setups.
I'm not saying one setup is a looser and other is a winner. You can win or loose on both, but naturally the cheaper one has statistically better chance of winning. That's what we are after.

I would have enter one for 2.75 but would hesitate with the second.
If I'd relay on VIX alone I had no way to spot the difference - I would enter both at low VIX.
Ofc the price would be, should be, my guide at this point but we are considering VIX alone.


Examples I gave are from different days. The principle of looking at ind. Strikes is even more obvious when occurs on chains from a single day. In such scenario you will find claendars that are ok, that are good and those you probably want to avoid. All of them sitting side by side, in same cycles.

Days like that, with good, bad ,and ugly cals sitting next to each other are not rare, but to be honest I do not have any statistics on how often they appear. It is possible that they occur once a week, or once a month. I spotted couple of those last week but I don't have recorded data handy. My take is taht even if days like that are rare, one should always use proper methodology. In calendar "case" the proper selection methodology relays on ind strikes not on VIX.


Of course all that is in my opinion, other trader may disparage and prefer to put convenience over probabilities and keep using VIX. It all depends.

One should know what he is doing, be aware of what he gains and what loses deciding on action.


==================================

Oh my! It was a lot. I ended up doing what I planned at the very beginning - a semi-class, a lecture. Maybe it's to much. But we are almost at the end. There is one more topic I want to touch for basics part. I will try to make it short.
 
Marcas, thank you for the extremely useful explanation of the IV contango and backwardation topic. I am familiar with this from my futures trading, but was very useful to use it in the Calendar setup for strike selection.
I like your quote: "The deeper contango (the lower short IV value is in relation to long IV) in a calendar spread the worse calendar is. The bigger backwardation - the better."

I did model both examples and have a few questions.

Why 21 DTE, and why only 1 day wide structure.

Both trades were in contango with the following numbers:

1st trade: Short had 11.09% IV,
Long had 11.24% IV.

2nd trade:Short had 10.54% IV
Long had 11.00% IV

How do you make profits in these examples?
 
Last edited:
Some explanation to the sentence you've quoted. I try to spell out much. Cant expand on everything. Questions do help.
So, this statement should be read that if we compare IVs from both strikes:
IV_long - IV_short
the bigger the difference (the higher number, the deeper contango) the worse cal setup,
and contrary, the lower the diff - the better setup. If we get negative value for diff - this is backwardation.

Means even if 2 cals are in contango one can be better than other.

Contango is natural state, backwardation is rare but much depends on dte (shorter dtes are more often in backwardation thna long ones).

All I wanted to show (for now) is that VIX is not that relevant. Later we can discuss that more. It can easily take full long post or two - I think I do it different way though (than producing yet another long post).

As per examples:
Why 21 dte? - this was the first example I stepped upon. I did not analyze used calendars much. All I was interested in was that entry was so much different with similar VIX.

Now, your numbers are different than mine. This is normal. Getting IV is not easy, each vendor do it his way. Important is to stay consistent fe. dont mix IVs from different vendors.
I use Schwab. My numbers are for the first one: long - 11.06% short - 10.9%; diff 0.16; price $2.75
second example: long 11.09%; short 10.65%; diff 0.44; price $4.90
(I don't have VIX data, and I tokk VIX values from TOS)

Aka the second was in deeper backwardation (greater diff) and was worse of those two setups (as reflected on prices)
You may get different values but this is OK (don't despair ;) ). I took data from 15:30 in both cases.
But as you see IV differences are very similar for you and I.
I don't want you to focus on details yet but grasp general rules and trends.
We can do calibration of models later if needed.


How do you make profits in these examples?

:) By luck and good management.
Management we need to learn and luck wont suffer if we give it little support. Paying attention to local IVs and selecting the best setups is part of that luck support. Actually one of the easiest things we can do.
 
Last edited:
Marcas, I thing luck is something more suitable for Las Vegas. My approach is being forever student of the market and lots of back testing until I am convinced that the structure is more than 70/80% profitable.

Do you have an actual Calendar setup that you trade on a regular basic and is profitable.

For example what was your last Calendar trade this week or a week before regardless of P&L outcome.
It will be way more easy to work with real values not a hypothetical trades. Tnx
 
I did not want to elaborate about meaning of Luck: in trading, thst's why smiley face is there. I definitely did not mean "blind luck", but there is element of randomness involved and skilled traders tried to take as many advantages as he can to shew probability in his favor. It is not warranty of 100% success - just odds of success are higher than normal (if what he is doing is viable).

Do I have favorite calendar setup? No, I rarely trade calendars as stand alone trades. Most of the time they are part of many/all positions and play specific role. It does not matter. I do not want to promote any specifics but make you able to evaluate anything that comes your way.
It may be easier to work on something concrete but if you don't have basics it will be a waste of time.Look, if I want to sell you a course I would do that, I would tell ypou some tricks, show you backtest results etc. and then sell you a class ot "the best ever strategy with 110% of success". I dont plan to do that.

Don't get me wrong,I'm not against courses and classes. I really think that if one take effort to select good services with trusty track records, he may do very well. Pay a fee, follow trades tath bring money, and dont worry. Don't pretend you want to learn something - just follow the trades. I was in such classes and noticed that trades offered there are decent but explanation sucks. Fe after making a good trade decision leader explains it, if at all, using terms like "cal expiration graph" or "VIX" - which fit nicely into clients expectations but really explain nothing.

If you want to be a student of markets you need to put some work.

You dnont like hypothetical stuff. Ok. I still have one to do. Imo, this will be the most important one - if you are willing to follow that is. I'm busy tonight and not sure about tomorrow, but will try to post is soon. I have some preparations to do first. After that... we can take some trade to the shop and look at it in light of what was said in this tread. Or we can do smth else. There is a ton of topics to cover.

To be clear. If you expect that I eventually show you some backtest results and offer you the miracle trade - forget about it, it's not gonna happen.
 
Marcas you completely misunderstand me. I am not looking for a setup. To work on details of a structure (Calendar per se), we need to have some real data, numbers etc to understand it.
For example if you don't trade Calendars alone, then you use them in some adjustment fashion.
The market is way too unpredictable and chaotic, therefore the only way to trade profitable is to have a setup, which has been back tested and worked in the past. And eventually will work in the near future.
Opening trades without setup is IMHO pure gambling.
I was asking you not to revile any of your trade setups but to share something with reasonable data so we can see it in real time.
That's not difficult if you have some trading experience under your belt, it is? Tnx
 
Last edited:
I did misunderstand then.
You are right again. To master this we have to look at work with real data. I think I mentioned before that there is a theoretical phase first and then verification what we've learned and then application. We should not look at real data without preparation bc we will have no idea what we are looking at and wont be able to interpret/understand what we see.
This refers to the method I offer. There are other approaches. You may study data first, then draw hypothesis, verify etc. Final results should be the same - path to them is different. I do "systematic approach' - theo stuff first.

Backtesting you mentioned is the worst method (should say 'is not recommended') - I make assumptions here - you said you were with Sheridan.
Let's not talk backtesting - it will open another big topic.
 
George, indeed this is a calendar.
But it not a simple one.

Do you like it? Would you trade it? Why?
Would you rather pass it over? Why?
Do you want my opinion? I can give it to you: In short, without going into details - from quick analysis it is to expensive for me. I would not trade it for other reasons as well but as I understand your your question (?) you think of stand alone trade. No, it is not good (for me, you still can be successful with it).

What bothers me is that you seem not to trouble with reading what I wrote. I understand it is not what you are looking for, you want action. Then I'm not the one you should be listening to.
First you have used at wrong numbers to determinate contango-backwd situation. You have used (+/-) averages for each cycle (averages of height for each classroom in m y analogy) - better than VIX but still short. Read what I wrote again. Focus.

This trade, even if looking at strikes IVs is indeed in backwardation -seemingly. There is a reasons why I suggested starting with 1 dte gap calendars. One of those reasons is that 'over the weekend' calendars are automatically excluded.
Your calendar is over-the-weekend. There is a phenomena of vol surface, that crates "ripples" over weekends cycles. Those has to be somehow taken into consideration in cont-bacwd estimation. There are few ways of doing so. We are not there yet. Not sure if we get there in this session.

I understand that all this stuff is new to you. It should not be so after spending a year in options trading program, but it is. I do not expect anybody to grasp everything in a single reading. Stuff I wrote is rather basic and should not be controversial, nevertheless, it takes time to absorb new material. We can discuss about what is the best way to deal with those ripples or which adjustment is the best - but not yet (how many times did I repeat that phrase already?).

I will post the last part of this - to complete the project. There will be some action there that may satisfy you, but if one tries to learn cals based on what I've written - he is not ready to trade - not yet. (;/) .As always, this is my opinion only, you may disagree.

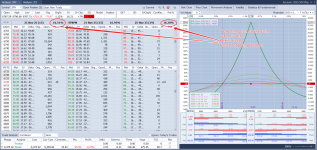
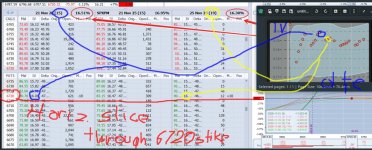
I will show you a pic of volatility horizontal cut for your date and mark your calendar. This is similar plot to which Jim showed earlier. On the plot you will notice end-of the-week "ripples" - well, thhey will look more like jumps, ripples are when you plot the whole surface. Do not worry if you are not sure what you are looking at - this is a jump in material to the part where you deal with live data and we are in theoretical part.
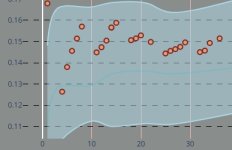
(My typing/painting is horrible. I included clean pic where you can esity observe those "over-the-weekend-" IV jumps.)
 

Attachments

  • horvolcut.jpg
    horvolcut.jpg
    77 KB · Views: 7
  • clean.jpg
    clean.jpg
    39.5 KB · Views: 7
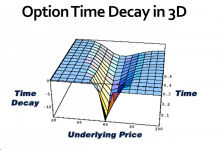
I have no idea about the charts you are posting, what these charts represent and how to read them. What I had learned so far is that one of the best way to make money trading Calendars are from Time decay and volatility in your favor.
 
> I have no idea about the charts you are posting
This is because we jumped ahead.
I will try explain, but this is potentially topic for later.
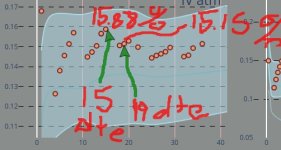
I took all IV values, from all exp. cycles. From those I selected only IV values associated with 6720 strike. Then I plotted this on a graph where x axis shows days to expiration and y axis IV value.
I attach a pic shown explaining it for 2 points. The plots I posted are live data (with those ripples) if you create theoretical model, there will be no ripples. You may try it out on your own, with excel for example, but this is up to you.

What you have on your 3D pic is theta decay plot of calendars (I assume bc for BF it looks very similar, or rather some unbalanced thing).
Attached comment said:
> What I had learned so far is that one of the best way to make money trading Calendars are from Time decay and volatility in your favor
About volatility there is no debate from me (assuming that you do it properly - as I have shown).
Volatility is such a broad term that it can mean a lot of stuff - not all of which are correct, but generally speaking - yes.

Theta. I deliberately didn't mentioned greeks. They often can be very deceiving, especially in calendars, especially if you trade wider dte gaps.
I do not pay any attention to greeks in cals onmy end.
I think that gamma would be one that is the best of them all, but that's only guess. And detailed gamma info is not very handy.
I appreciate if you can explain why theta and how do you use it.

A fine art pic illustrating how dotty graph was constructed.
 

Attachments

  • slice3.jpeg
    slice3.jpeg
    521.9 KB · Views: 5
Last edited:
It time to talk about smth I consider to be the final part of theoretical preparation.
I tell about method I used to learn calendar spreads, how individual inputs affect the visual representation of a trade (risk graph) and how they work together, how they interact. I like this way, have used it for many option trades, you may not, nothing wrong in using different approach. I share what I think is good (the best ;) ).

Originally I planned to manually walk you through various scenarios, various input combinations and point out to what I consider to be important but..
a) it will be a lot of typing and a lot of graphs = work, and I'd like to take a break from typing.
b) I think it will be much more beneficial if I give you a tool instead. This way everybody who's interested can play with the tool and focus on parts that he is interested in.
Beside doing it on your own is more fun than just reading.

The concept is very simple. Take an option model, any will do, and plot a starting graph of a calendar. Then change one of parameters and observe how graph changes. Do it couple times and you may start developing a sense what given parameter does to the graph, then select another one and repeat the process. Then start playing with both parameters and observe how value of one of them affects the other.

My suggestion is to start with, obviously, the most important params: long_IV and short_IV.

Later, if you have the ability, you can use live chains along and try to figure out if the impact you observe on dry modelling matches changes on real data. If you don't have ONE or like, you can use TOS (or like) and capture data for further analysis (this method may have advantages over ONE, but it is not that important. You may also use TOS alone - less flexibility but you can play with individual IV values there.

The goal of exercise is to get oneself familiar with intricacies of calendars. This will be very helpful later when dealing with real trades.

My plans were to take a broad view, to look at brad range if paarameters (Strike, ATM, IV, dte and so on). If you are, instead, interested in only some specific part of it - say you want to play only with 21dte/14 dte setups, fine - less work, or if you want to test what impact specific IV event has on long dte vs mid dte vs short dte calendar setups - start with that. It's less data to deal with - easier to comprehend. Not that it is that hard to look at everything, just catch the relationships and you are golden.

Summary, no step by step guidance from me. You are on your own equipped with a tool.
I encourage those who want to proceed with the exercise, to post their observations, share challenges, solve problems, discuss stuff publicly with others. The work will progress faster, will be more thorough, will be more fun. I plan to limit my posting and comments.

In next I'll lay out technical details about the tool.
 
Last edited:
This is about techicalia.
The tool is a simple Python code.
It contains essential parts of plain Black-Scholes model and some additional functions to do calendar calculations and plotting.

If one is using Python already then no need to read further. Download the script and fire it up. You know what to do.


If one is not familiar with Py or coding - no worry - I’ve prepared the script in a way that one can play with IVs without even looking at the code.

You do need python on your OS though.

- if you are on Windows, you must first install Python. There are couple ways to do it, there are plenty tutorials - use them (but may look my advice below).

- if you are on Mac or Linux you can download the script, unpack it, open terminal where the script is and type -> python3 simcal.py <- this will produce basic plot and then you can start testing. I don't recommend doing it this way (see below).

My recommendation, for whatever OS you use, is to install uv from Astral first. UV is a modern tool that will take care of all python related tasks and additionally will run the code in isolation from your system - not that it's needed but it is a good practice.

For installation instructions look up Astral page it is simple.
If, after you managed to install uv (get valid response to command -> uv -V <- (type this in terminal/PowerShell) and need some help - shout out - I can give you a hand here (it's only 2 or 3 initiation commands to set up the project.

If you wish you can use alternative methods. Imo, very handy and convenient way to work with python codes, like this one is to use jupyter lab, or one of it's cousins. One of "cousins" is colab by Google, where you don’t need to install anything and use browser to access it - like (?) Google sheets. It's not straight forward method, there is some learning curve. No support from me. Seek tutorials.

If you are completely new I recommend starting with uv and add jupyter only later on - if one wishes so.

The code itself is simple, no fancy stuff, should be easy to understand.
It is not the prettiest thing but it works.
Script requires a single outside library for plotting named "plotly", which must be installed for script to run (one command, one time will do).

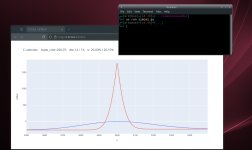
I call the script "simcal.py", if you run it as is it will produce a graph in a browser - see attached pic.

The script can take 2 (exactly 2) arguments.
The first one sets IV for long leg, the second sets IV for short leg.
example -> simcal.py .10 .095 <- will plot a graph of caendar with IVs 10% and 9.5% correspondingly.
Code is not user-proof. if you type -> simcal.py .'z' .095 <- you get an error.

Other parameters are inside the code, you can change them there.
Default values are random. One can set them as starting point for favorite setup.

I think that's most of it.

Of course the script can (and should) be changed, improved, simplified, rewritten etc.

I encourage you to:
- help each other to start with the code. There are experienced traders/coders here.
- modify the code the way you like. THere is a lot that can be done here, starting with interactivity - instead entering parameters each time you can use sliders (as an example of possible modification).
- if working with python is difficult or impossible, and if there is interest, the code can be translated to Excel (and you can use TOS to execute same idea - bit more tedious but doable).
- a tons of automation can be used to improve workflow - all depends on demand.
- most of all, I encourage you to give the script a try. It will help you to get familiar calendar spreads on deeper levels. As you get more and more advanced start comparing results with live calendars. Look at graphs in your plotting software and think what parameters could case changes in plots you see. That will empower you to open, adjust, close calendars precisely according to your needs - no randomness. I don't say you always win, but you will know exactly what happened which give you a chance to modify your strategies with more precision.

I bet I forgot to mention a bunch of stuff, but that's it.
Enjoy.
(I will enjoy break from typing and thinking.)


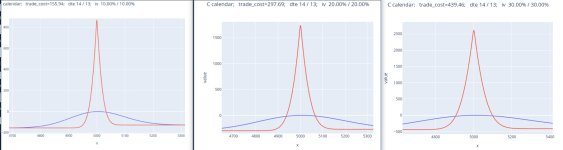
Attaches are pic of basic plot, example of comparing plots in different volatility regimes and script.
 

Attachments

  • simcal_example.jpeg
    simcal_example.jpeg
    206.4 KB · Views: 6
  • comparison.jpeg
    comparison.jpeg
    169.4 KB · Views: 6
  • simcal.py.zip
    simcal.py.zip
    1.8 KB · Views: 0
Last edited:
Marcas, thanks for getting to the meat of the matter, meaning having some actionable values to play with. I absolutely agreed with you that playing with them, by changing the parameters is the way to learn the intricacy of the Calendar or any other option structure.

"I appreciate if you can explain why theta and how do you use it"

To answer your question will take few pages, therefore the shortcut is to go the ChatGPT and ask the following question- "How option calendars make money". And there is your answer.
 
Pages?
I can show you in few sentences why I think is false, or better to say not very good indicator for calendars. theta.
Can you briefly explain it, very briefly, one or two sentences should do. I don't gpchat.

(And you also should be very careful with ChatGPT. I heard people are calling it new religion - maybe. But what chat GPT does? It searches internet for answers. THe answers on internet are not always good. I observe bad (let's say not very good) teaching lasting long time, echoing in different parts of opt education.
I may be wrong, am ready to correct myself. Looking more for Why than what.
 
Option calendar spreads (also called time spreads) make money primarily from time decay differences (theta) and implied volatility changes (vega) between the short-term and long-term options in the position.
Let’s break it down clearly 👇

💡 Basic Structure​

A calendar spread usually involves:
  • Selling a near-term option (shorter expiration)
  • Buying a longer-term option (same strike price, same type — both calls or both puts)
Example:
Sell 1 AAPL May 100 Call
Buy 1 AAPL June 100 Call
This is typically a net debit trade (you pay to enter it).

📈 How It Makes Money​

1. Time Decay (Theta Advantage)

  • The short-term option (front month) loses value faster than the long-term option.
  • As time passes, the short option decays quickly, while the long option retains more value.
  • If the underlying stock stays near the strike price when the front-month expires, you can buy back or let expire the short, and still hold the long option that retains value.
Ideal scenario:
The stock stays near the strike price of the calendar through the short option’s expiration.

2. Implied Volatility (Vega Advantage)

  • Calendars are long vega: they benefit when implied volatility rises.
  • A rise in volatility increases the value of the long-dated option more than the short-dated one (since the long one has more time value).
So:
📈 Volatility ↑ → Profit potential ↑
📉 Volatility ↓ → Profit potential ↓

3. Price Behavior (Delta Exposure)

  • A calendar has low delta (small directional bias).
  • It generally profits most when the underlying stays near the strike (non-directional trade).
  • If the underlying moves too far away (up or down), both options lose value due to being out- or deep-in-the-money, reducing the spread’s value.

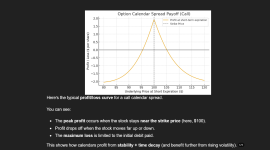
💰 Example Payoff​

At the short option’s expiration:
  • If the underlying = strike → max profit zone
  • If the underlying moves far away → loss
  • Profit is capped, but losses are limited to the debit paid.

⚙️ Profit Components Summary​

FactorHelpsHurts
Stock price stays near strike✅❌ if it moves far
Time passes (near-term decays)✅❌ after near-term expires
Implied volatility increases✅❌ if volatility drops
You overpay for the spread❌

Real-World Example​


You buy a $100 call calendar for $2:


  • Sell 1 May 100 Call
  • Buy 1 June 100 Call

If the stock stays near $100 until May expiration:


  • The May call expires worthless (you keep its premium)
  • The June call still has good value — maybe worth $3+
    You sell it and lock in $1 profit per share ($100 per spread)
 
Except for defining IV of the legs, the rest of our chat was just chatting.
The Calendars are not that complicated, you need to pay attention for few small things, practice and that's it.
I hope it was a great refresher for some and start of the option journey for others.

"Make everything as simple as possible, but not simpler".
Albert Einstein
 
Last edited:
Top
Contact Us