Calendar spreads

Jim, I don't think the initial price increase or reduce anything, its just the debit/ cost of the trade, VIX or higher volatility (market going down) is what increases the width of the structure and obviously lower volatility (market gong up) is when the structure gets smaller. Of course it does affect the value/ price of the structure at the moment of placing the order but that is as far as this goes. Afterwards that initial price doesn't change at all.
P&L comes from the legs getting higher or lower in value and the net of that value, coming from IV and Theta decay.
The width of the B/E from ATM is due to 1SD of IV of the structure and as IV expand, structure gets wider and B/E get further away from ATM too.
 
Last edited:
by definition, the initial price is the cost of the trade and doesn't change; ever. i agree with that. but if i may get technical for a minute, lets review what the vix is. it's an index representing the expected future value of volatility of the spx calculated from an complex formula combining iv from calls and puts with a nominal expiration time of 30 days. the vix doesn't cause anything. i'm in the process of experimenting with calendar prices and iv. i have a tool that lets me modify the prices and the iv independently. before i show any results i want to do more tests.

volatility in and of itself doesn't change the cost of a calendar. a calendar is a spread: you buy one option and sell another. the cost is the difference between the 2.

re: "The width of the B/E from ATM is due to 1SD of IV of the structure and as IV expand, structure gets wider"
i don't know what the iv of the structure is. can you explain how you get that? from my experiments, the width of the break-even prices is determined by the difference between the iv of the 2 options. i'm still looking for what else changes them.
 
Jim, I love your thinking but if we look from the psychological point of view, then what you said "The VIX doesn't cause anything" called for interpretation.
VIX is mean reverting, which means that if enough traders believe and act on their believes, as soon as SPX start going down, they (Pension funds, banks, insurance) jump and start buying puts and selling call to pay for their purchases and therefore that act trigger move of volatility on VIX
Since VIX is based on volatility (act of buying and selling) and Implied volatility (IV) is part of the BS formula, as volatility expand, so is the SD and strikes move away from ATM, which makes the structure wider (hence B/E points get further away from ATM).
.
 
"volatility in and of itself doesn't change the cost of a calendar. a calendar is a spread: you buy one option and sell another. the cost is the difference between the 2."
The volatility is one of the main reason that prices do change which affect the cost of the Calendar (net price b/w legs) higher volatility brings more premium.
Volatility on both legs are different and change differently as time goes by, too.
 
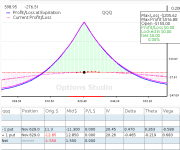
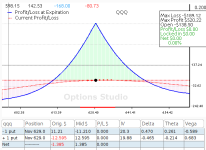
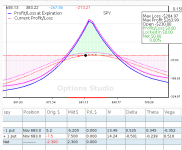
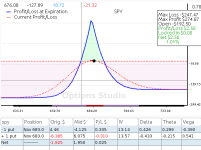
the following graphs show a real calendar as well as a similar hypothetical calendar that demonstrate that higher volatility doesn't necessarily result in wider break-even prices. i took the original calendar parameters and slightly changed the prices to create a higher price and higher iv. then i compared the risk graph to the original. although these are theoretical prices, they are not unreasonable and can certainly occur. the iv for the new prices is the computed iv for that particular strike. the spy calendar short strike expires on nov 7th, the long on nov 14th. the qqq calendar short strike expires on nov 21 and the long strike on nov 28.

in both cases, the expiration risk curve for the original calendar is outside (wider break-evens) than the modified version. in many cases, calendars with strikes with higher iv have wider break-evens, but it's not a rule. also calendars with higher iv generally have a lower max profit/max loss ratio. i want to see if we can come up with some guidelines to help avoid entering a trade with an initial disadvantage.

1762030202772.png1762030181234.png1762030142006.png1762030037209.png
 
Well Jim, we are not on the same page and apparently have different understanding about calendars and how they work.
If you check Amy's 2023 A14 course, somewhere in the middle of it, she has a wonderful explanation of this phenomenon
BTW, I have no connections whatsoever to her or this site, just a curious student trying to learn..
Sometimes using the right software can help too and I would recommend ONE as one of the best tool for back-testing and modeling your option trades.
 
@GeorgeD my understanding of calendars is from what my model shows me. there's always a possibility of a flaw. earlier you said you can calculate the break-evens. show me how and i'll try to incorporate it into my software.
 
Jim, the B/E of a calendar is based on the expected move of 1 standard deviation from the mean. If you have access to TOS, you can see it on the option graph. Or when using ONE, it’s display on the modelling window by a slightly darker colour.
 
@GeorgeD oh, i thought you had a formula. i have thinkorswim and the lighter gray area on the risk graph is the standard deviation of the underlying stock, not the calendar break-evens. you can select the end date you want the standard deviation to span. i don't have option net explorer but from the pictures i've seen, the blue-grey shaded area looks to be the same. the break-even calculations for a calendar are more complicated than calculating a standard-deviation of a single iv and single time frame. there are 2 independent ivs and 2 independent expirations to deal with.
 
Jim, you are right,I got mistaken about that, but in reality you don't need to calculate anything there as you can see them on the Risk chart when the price it testing B/E points. The B/E are showing where the Expiration line is crossing T0 lines, that;s all.

Expiration B/E is the price level at which the underlying asset must be at expiration for the options trade to neither make a profit nor incur a loss, factoring in the premium paid or received for the option(s).
 
And here is the formula if that is what you were looking for:

What Expiration B/E Means


  • The break-even point is calculated by adjusting the strike price by the premium paid (for buyers) or received (for sellers).
  • For a long call, the break-even is: Strike Price + Premium Paid.
  • For a short call, the break-even is: Strike Price + Premium Received.
  • For a long put, the break-even is: Strike Price - Premium Paid.
  • For a short put, the break-even is: Strike Price - Premium Received
 
You, gents, have moved deep into calendar territory.
I feel the urge to join you, post some plots, add comments, ask questions etc. I have the impression that often you discuss opposite sides of the same coin, but I prefer stick to the plan I spelled out earlier and continue with basics. "Systematic approach" is more beneficial (my opinion) than jumping back and forth over calendars (SD/BE topic is way ahead from where I left) even if that way may seem more dull.

Moreover, sticking to the plan will bring us to the same level quicker. If we want to progress in orderly manner we need to understand each other (not necessary agree), aka we need to be on the same page. I sense some 'misalignment' in your posts.
I don't intend to go much longer - I have about 3 more posts in mind - that should be enough - for start :)

I welcome, very much so, bringing calendar explanation by Amy, that GeorgeD mentioned. Or any other explanation. I am not particular familiar with Amy's teaching. I remember hers nested condors trade - I was interested in it, but that’s about it. I try to stay open to expand my knowledge (with caveats) and to learn new perspectives (Jim's quest about BE is an example of such new perspective). So, by all means, George, bring Amy's explanation into discussion ... just not now, please, not just yet. Let me be done with those 3 posts, so we are not jumping all around.
(added: IT will be great if you can ask Amy to join us with her knowledge - although as much as I know (not much( she's not participating in public discourses)

Responses to some posts - not that I agree or disagree with the rest ,but I leave it for later.
i would add iv differential (horizontal skew or term structure) and calendar price to your list.
You are going straight to the meat, Jim! I did not mention iv diff directly because till then we were dealing with VIX. I ofc, did not forget about that but hide it, for the time being, in the "volatility" point.
I aslo didn't forget about the price but I've planned to bring it in later when (if) we talk about calendar graphs in more details, but you are righr, price is a factor that need to be considered, beside - it is easy to monitor. We definitely will talk price. I try to introduce stuff gradually.

the width of the break-even prices is determined by the difference between the iv of the 2 options. i'm still looking for what else changes them
😄 I can answer this, Jim. The answer sits in front of your face and you are staring often at this "what else". No surprise you don't see it 😄. In daily practice those are not to be bothered with. What you mentioned - 2 options - are essential (in a context though).

One more thought about being on the same page.
I know where Jim is at, more or less. For example when he says about fake Break Even points. I know what he means (in this case fake =~ not trustworthy.) He refers to BE width as a way to validate calendars, not as typical BE known from e.g. condors. I don't seek any explanation about "fake BE points".
On the other hand when I read that "P&L comes from the legs getting higher or lower in value and the net of that value, coming from IV and Theta decay." in GeorgD's post, I'm not sure how to react. Objectively value of an option leg does not come from IV nor theta. Objectively this is not a true statement, but this short is often use by traders, inclining myself. So, should I dig into this more or take as a good coin and move on? Later posts suggest that there is indeed backward understanding how all this BS stuff works, and some explanations are required. This is a reason it is important to be on the same page - so all have proper understanding of what is said, regardless if we agree of not, and we dont have to spend time explaining ourselves

Jersey Jim - thanks for thumbs up. From it i get what is important to me - more traders are interested in the topic.
I wait for thumbs down that come with a reason why the thumb is down, this should be more interesting :)
But thanks. Appreciate it.

OK, in next 3 (or so) posts I plan to do introduction about calendar graphs - want to focus just on a single, but important part of it, then do a short explanation why VIX is not so great for calendars, and after that we may take a deeper look at calendar graphs (kinda of what was in Jim's post but I do it differently).
You dont have to wait for me and keep going on. I may join you later, or we can do smth else. No jumps for now.
 
Last edited:
Markus, you are absolutely right, jumping from topic to topic is more or less confusing for someone just getting into the option world.
Lets start from the beginning as you said in one of your previous post.
Therefore I am re posting my question to you:
What conditions the underlying price of SPX has to be for us to consider opening Calendar in the first place, or should we just look for something else for a signal? Tnx
 
George this is where I'm going to, at least where my aim is.
If I'm forced to answer you question right now, I give you my favorite answer: it depends.
Seriously. What I mean by this is that there are may types of calendar setups you can trade, and many of them have opposite parameters for entry. I can't answer your question without specific context. I prefer do something else; give you the knowledge (as much as I can, say, basic knowledge), that you don't have to ask those questions, or rather you can add whatever context you wish (by that I mean ~ type of calendar trade) and answer your own questions.

I mean we can discuss some particular setups but I rather work on general plain - that;s why we established a "unit" calendar to work on. This is, as I see it, bare minimum. After we get familiar with that - the gates to the oceans are open.

I try to focus on those 3 very essential posts first.
 
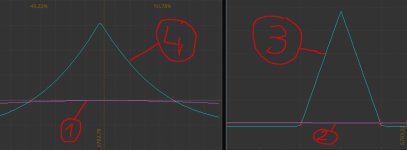
Let's focus on a risk graph of a calendar spread - something a calendar trader is typically staring at quite often.

Take a peek at attached pic. There are four marked lines on it. Line nr4 is the subject of this post.
(If this concept is already known to you - ask no questions - we move. Make sure you understand it, it's kinda important.)

Line nr 1 is called t+0 line, where "t" means present time and "0" means " future time from now in days.
T+0 line is a rough approximation where P&L of a trade will be if underlying move up or down today.
T+1 same but refers to tomorrow. etc.
Those lines are never accurate. If in retrospection you find that your actual P&L is what t+0 predicted - it's only by a chance. This is rare occurrence.
The most accurate place on t+0 line is at the spot price but even there it's not 100%. The further away from the spot, in distance or time, the more speculative the line is.

Line nr 2 is also a t-line, t+0 line.

Line nr 3 is called an expiration graph. It shows you exactly how your P&L will look like at the trade expiration. To the penny, no room for guessing.
Characteristics of exp.graphs are: straight lines, and sharp angles, but the most important one is it's reliability. This line is rock solid.

Line nr4 - our focus - is also called "expiration graph" but it is not an expiration graph at all. This just another t-line.
I guess that reason for misnomer was introduction of graphing software, like TOS or ONE. Someone, not paying attention, looked at a butterfly graph, then looked at calendar graph. On calendar graph he did see a blue line above a purple one, same as in butterfly, and automatically called the blue line on calendar plot an "expiration line". Nobody corrected it and here we are.

Before computers and graphing software floor traders, and retails as well, did not have problems with this topic (my guess only).
This is a trap, a mental trap, that new traders fall in - likely no by their own fault. Only few mange to get out (last time I've' checked was... few years ago. I only hope this is not as wide spread as it was back then).

The biggest downside of having this wrong is in trade management but it shows in other places too. Godd example was in the discussion above.
The talk was about break even points of a caledar graph. Greg provided formulas to calculate BE, correct ones, but those formulas are for true expiration graph and have no use in t line calculations aka you cant use them to calculate calendars BE. If one realizes that, despite the name, we are not dealing with true exp graph all becomes clear. I hope.
Accordingly should be all assumptions and comparisons of BE points - they are not the same as in butterflies, they mean smth else (not sure if this is the case from discussion, I try to talk in general terms).

In short: a calendar "Expiration line" is a combination of true expiration graph from short leg and long leg t-line, where days( t+day) is set to the day when short leg expires. This line shares importatn property of t-lines - it moves around and you cant relay on it.

If you are still confused, try to plot line nr4 on attached picture in different color than line nr3. Maybe some shade of purple?

I suppose the name "calendar exp graph" will stick, but whoever introduced this name should by a pizza and those who spread the idea should by a bear for everyone every time they fail to make distinction and teach that a calendar 'exp.line" same butterfly exp.line.
 

Attachments

  • calbuf2.jpeg
    calbuf2.jpeg
    199.2 KB · Views: 12
Last edited:
re: In short: a calendar "Expiration line" is a combination of true expiration graph from short leg and long leg t-line, where days( t+day) is set to the day when short leg expires. This line shares importatn property of t-lines - it moves around and you cant relay on it.
marcas, there's no argument from me that this line is a t+n line, but in a strict literal sense, i don't see a problem calling it a calendar expiration because when the short strike expires you no longer have a time spread (calendar).
 
Yes, I wont argue about the name itself but the point is that character of this line, its behavior, follows what t-lines offer.

You may think of "the point" using example of a narrow butterfly (BF - 5pw).
Rarely you hold this one to expiration. Say, you set a rule that you enter this at 10 dte and exit at the most 5 dte. Then if you plot a trade as t+0 line and t+5, but not the expiration graph!, you have the same situation as with calendar - with exception that in BF case it is you that decided on 5dte exit, and in calendar case it is the trade's intrinsic (which also you selected but at different tradring stage).
Then - what you are doing with "calendar exp.graph" is analogue to t+5 line on BF. You can ofc call t+5 "expiration graph" of your trade, but you must realize of the difference - that has it;s weighting on interpretations of results (not saying you dont do it).

Technically, calendar trade ends with expiration of the long leg. That you exit earlier (for good reason) doesn't change that.
 
re: Technically, calendar trade ends with expiration of the long leg. That you exit earlier (for good reason) doesn't change that.

my bad. you are, of course, correct. the long still has time left.
 
Actually if we want to be technical on this- the Calendar ends when the short leg expire, we cannot call it Calendar any more because we have a single leg by itself.
Its the same if for example:
you start with a vertical- you have a vertical, but the moment you add another vertical then:
- if the shorts are the same, we have a Bfly
- if the shorts are not the same, we have a condor
if you do Calendar, the moment the shorts expire, then:
-if you are on the put side, you end up with a single bear position,
-if you are on the call side, you end up with a single bull position
In both cases the margin is enormous.
Therefore the real money generator is the short, the long act as a hedge, and once the short is gone, the Calendar is gone.
 
Last edited:
You are correct. Jim, I knew you knew. It was an opportunity to explain "cal exp line" from another angle.
George, you touch interesting topic. I was debating including it to "cal.exp line" post but decided to postpone when we can apply some practicality.
As "cal.exp lines" are metal concept, the "calendar" concept is the same. Calendar trade is a mental concept.

The only real things in options trading are single calls and puts. Anything above, starting with vertical spreads or calendar spreads are mental concepts.This is powerful observation that we may take advantage of later when (if) we talk trade management.

calendar trade ends with expiration of the long leg.
I try to precise in this tread, but here I failed - technically speaking :) ).
Hhat I meant by "calendar" in this sentence was "trade".

More precise version would be smth like this:
When entering trade that in focus we sell option in one expiration cycle and buy in another one. We call this configuration a "calendar spread". After short leg of the trade structure expires, we are left with long leg. The whole trade ends (in the simplest scenario) when long leg expires (or when we close all legs involved in a trade, or when we mentally assign part of that trade to another one).
Once short leg expired, we are still in the trade but but not in calendar configuration.

Pls, don't ask me to expand on it if smth is not quite clear. We can skip this all together for now.
 
Top
Contact Us