Calendar spreads

@Marcas, whatever you're using to create png files isn't compatible with this forum software. i frequently use gimp to create image files. it knows how to create several types: gif, tif, bmp, png, etc.

what i did for my calendar price calculations was to price a 1day, 2day, 3day and weekend calendar for several consecutive weeks.
 
I was scared off by the large vega/theta ratio
Bill, can you elaborate on that?
Why this ratio matter? Did you look at historical performance of structures with this "scary ratio"?
I'm really interested in your point of view, and Jim's, on this. I know traders who do look at theta/vega but never found convincing explanation. With time spreads those two greeks are very unreliable - they are purely "academic" numbers.

i don't want to start a debate of these controversial topics in this thread
Why not? Controversial topics are the ones worth debating. (by which I mean seeking the truth, not playing with egos or commerce).

Jim, I noticed before that my pics have problems with forum. It wasn't so earlier.. I use standard screenshot feature - wont mess with it for now - I;m about to refresh/change whole system. I just use zips if I have to.

What I did is provided an illustration to your assessment about weekend clds (I call calendars taht in coding bc of confusion cal/call ...) , an illustration that weekend calendars are indeed priced as you said, as 1.5 - 2 degree clds. Pic contained prices from today's chains. In research and when producing stats I avoid mixing 'normal' and 'weekend' clds.

This is interesting point in taxonomy of calendars. I categorized weekend clds as 3rd degree (or 3d) - having nominal 3 day gap, but I think that weekend calendars should have their own marking (like "w") to avoid confusion. (Some may say to add to confusion).

While working on Flyagonal(ish) trade, I come up with some strategy which I like. It's rather dynamic. I did only thought trading with it -no modeling, no testing. To early to elaborate but that's what I'm working on now and your and Bill's conversation naturally hit my curiosity - the more perspective the better (and merrier too).
 
Why not? Controversial topics are the ones worth debating. (by which I mean seeking the truth, not playing with egos or commerce).


While working on Flyagonal(ish) trade, I come up with some strategy which I like. It's rather dynamic. I did only thought trading with it -no modeling, no testing. To early to elaborate but that's what I'm working on now and your and Bill's conversation naturally hit my curiosity - the more perspective the better (and merrier too).

i guess the weekend dte issue isn't that controversial, but not many people know this. as for the weighted vega. some people are absolutely adamant it's not a factor. no matter how much evidence you show, they won't believe it. others are opposite. i'm also not completely convinced you can accurately calculate weighted vega. i've seen the iv differences between front and back expirations vary a lot on price moves. but i'm convinced it's real and some calculation attempt at least helps in highlighting the effect. i prefer not to go through the effort of debating it.

as far as your flyagonal strategy, are you willing to share it? i've modeled some and with the lower volatility now it doesn't look as attractive. i will continue to monitor it.
 
Ah, weighted vega. I have similar experience with it. It was so long ago... I think Taleb was the original propagator of the idea. It is useful thing but not possible to accurately catch with a model - as many other things (delta, theta gamma etc). You are right about how some people treat models. If TOS or ONE or anything says theta is 13.0345 then theta is 13.0345. :) In a sense they are right though... Understand avoiding those discussions. For me, what is important here is the underlying approach to options trading, a philosophy, if you will. It has to do with early education in options (in my time it was like 95% Dan Sheridan Inc) but also with personality. Sometimes you debate weighted vega but what you get is knowing other man better.

Anyway, Yes, I'm willing to share what I do but I'm not willing to write long posts anymore. It feels like, pardon the language, content creation - content consumption. I may statart asking for donations... (I wont do that ).
I'm also not a blind buyer of Flyagonal/ combo structure anymore. It is not optimal, although sometimes can be :) i did couple tests and the spell I was under disappeared. Not that it can not be traded but it's not for me, and I wont follow it anymore in a strict sense.

The trade ("trade") I mentioned is in very early stages of conception. Elements of it are not new (of course) and many are sill vogue to me. It is not your typical "named strategy" for sale, but rather concept of trading options that suits me. I do not want to interrupt your sharing though and 'd like to hear more about your ideas. I do not like the trade you showed - similar reasons to what Bill said - but did not think about it much. You did not fix your app re exact expirations and I didn't attempt to recreate it on my end. I need to touch it to tell more, to simp;ify it maybe.. A TOS orders for copy-paste?

Btw this - a need to touch a trade - is behind "my trade". I planned for a long time to really dive into time spreads.Did partially theo part (modeling concepts, RRZ sheets, performance tests etc, but get bored...), now I started with a calendar in my trade just to have a stake on the line and to leave theo world - it does not need to start with a calendar. KK I shut up, and listen (will be busy for few days, maybe away). I plan to have a small trade open and live test some concepts. But I'd like to hear more about what's behind your trade, what you want to achieve. If the trade can gain 20% in few days it can also dive 20 in few days, doesn't it?

(I may be off for couple days. My positions are very light. It;s better fo me ti shut up anyway.)
 
Hi Marcas - here's a bit of my background and POV. Have been options trading about 3 years. Initially motivated by impending nursing home costs ($15k monthly). Better to earn a high return on your nest egg than to spend it down. So I was an eager student. Started with Amy Meissner's A14 course and OptionNET Explorer for visualization. This is a good trade (BWB with small calendar as adjustment) and relatively insensitive to vol changes. It is short term with good consistency but relatively low return per trade & I was timid about scaling up very much. I discovered that time spreads give much higher theta but after a few experiments with them noticed that P&L can stall or even sink even when price and theta say it should be growing. I watched this happen in real time on the ONE risk graph. After a while I realized this was the invisible hand of volatility at work and that it can at times have more impact than delta or theta. I did not like these surprises & started looking for vega neutral trades. With this perspective I came across the put diagonal+call bwb combo at about the same time as Steve Ganz, and for the same reasons. The difference was that I was doing it for myself while he would be commercializing it. In my personal notes I call it XW for eXtraWide. Goals for a setup are max theta, min vega, high capital efficiency, and wide enough to robustly endure current market expectations. And, of course, each parameter is normalized to committed capital (BP).

Ideally vega/theta=0 means no surprises due to volatility change. I realize reality does not exactly match theory but the numbers on the ONE sheet are all I have to go by.

I should note that this matters most with the short term trades that I prefer. Volatility is cyclical with (usually) a 7 to 14 day period, driven by the frequency of external events. Thus trades with DTE greater than 14 days are likely to have volatility return to the starting point within duration of the trade & the cycle will have minimal impact unless it is quite severe. This is just my observation. However I prefer DTE in the 4-11 day range to get more benefit from "rinse & repeat".

BTW I'm now trying out a version of XW that has 4 strikes (rather than 5), which lets me enter a single 4 leg order then place a GTC order to exit.

Sorry this is such a long story but it explains why large vega/theta ratio scares me :)
 
Last edited:
BTW I'm now trying out a version of XW that has 4 strikes (rather than 5), which lets me enter a single 4 leg order then place a GTC order to exit.
That is a great improvement. I still trade Amy's TimeEdge calendars. Even with the adjustment (diagonal) it can be closed as a single combo.

Is it then a call BWB plus call diagonal with the lower call of the BWB also as part of the diagonal? I'm not sure, I get it. Would you consider posting a risk graph?
 
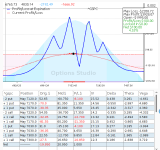
i modeled another trade that has 2 butterflies and 2 calendars. this is almost as wide as the serf trade but it shows a better theta/vega ratio of 111/70, for what it's worth. i overlaid the bell curve, and it covers a +- 1 std-dev spx move. don't worry about the gap in the middle, the t0 line will span that till near expiration. this uses a may8 expiration for the butterflies and may8/may11 expiration for the calendars. this still has a lot of strikes but less than the surf.
spx_df_dc.png
 
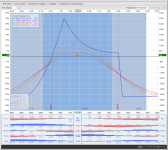
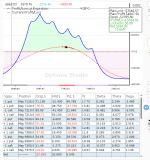
@Uwe I like Amy's TimeEdge as well and I use it occasionally. Very simple to open and adjustment path lets you follow the market as long as it doesn't move too far. Here is a pic of an 11DTE 4 strike XW ("4XW") that I put on yesterday. It's very simple: start with a call credit spread 20 to 25 wide at roughly top edge of expected move at expiration. That's the edge of the blue band in the pic. Then add a weekend put diagonal with short about halfway between current mark and lower edge of expected move. Place put long far enough down to roughly balance upside & downside risk. Trim the put strikes if necessary to get delta close to zero & check that vega is sufficiently low. If vega is too negative you can move the long put a day or 2 further out. That's it. Checks most of my boxes plus I can enter with "one click" and set a GTC to exit. Only downside is I'd like to see more theta per margin $ initially but it's not too bad. I'm gonna experiment with making the call side also a diagonal for the first day or 2. Depends on which way I think vol will move. Can also experiment with different proportions between calls and puts. Note that width between BE's is almost 350. Should be quite robust! Also note that 1 day in the P&L tracks theta nicely.

Full disclosure: the pic shows a trade with 2 lots in the call CCS and 1 lot in put diagonal, which is Friday-Wednesday.

1777434470636.png
 
William, thank you for short info. It helps to know, or to have anchored estimate about knowledge and level of an interlocutor (is that a word? :) ). Looks like you had a good start, better than mine for sure. I refer mainly to being "eager student". Also you landed in Amy's course -I do not know any of her courses but from what she dripped here she is good ( I did not watch or dont remember anythig about A14). When I started there was no higher level option education and as result I was fed with half truths, almost truths, conditional truths and so on and couldn't discern on my own nor compare to any other opinions /pow. I took some courses ofc but mostly worked on myself - learned coding for this reason alone... mostly for this reason. I think I tend to like coding bit to much and spend more time on it that is necessary. Trade long and short terms. I really like 0 dte but don't have time for it. about 14 dte is where I focus now.

What was taught in my learning days and still is (although I do not follow closely) is "a strategy" - a setup with some adjustment moves, and low profit target, typically 5% or so. I do not pay attention to those. I aim for higher returns, the longer I plan to be in a trade the higher returns I seek. To get there my primary goal with options trading is to minimize risk asap and leave open opportunities on the table. I laid it out rather extensively when talking Flyagonal setup (not the Flayagonal trade itself!).

As per theta/vega ratio. As you observed yourself, theta and vega numbers in time spreads can not be trusted. They tell very static story/prediction that never happens in trading. I know many strategies out there keep adding calendars to "improve vega exposure" but this is just a selling/talking point for novice traders - the "prove" is mostly done in simulating environments - like TOS or ONE. It may work for some time if market cooperates but it is not, imo, bread and butter strategy. Caveat: indeed you can setup a trade to skew theta and vega working for you but it wont be a setup that works all the time (like vega in calendar neutralizes vega in BF so that pair can be traded anytime),

I do like you are playing with strikes and tweaking them to achieve your goals. And you are only in 3rd year of options trading?! I'd like to exchange experience with XW and what I'm doing.
Jim posted 2 of his setups I' d like to hear more about those too. How the trades are doing, even if on paper account, how many of cycles they were tested on. This can be additional valuable info about calendars.

I see your risk graph. First thing I see is horrible risk/reward ratio, no wonder you hesitate to go in size. Must have solid and robust defense in place. How long did you trade this?
 
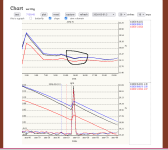
bill, thanks for sharing your trade. i modeled it and did some analysis on it and i'll share that data. this trade is mostly invariant to changes in iv as long as both expirations change the exact amount AND you stay at the current spx price. volatility doesn't change the same all the time, as i mentioned earlier. i closely monitor iv throughout the day and i captured an image from yesterday. i circled the expiration range on the top iv graph to indicate the dte range of your trade. you can see for any single sample it's relatively flat over that period. but you can see as time goes by and it ends up at shorter dte, the slope changes. in this particular graph, ignore the steep slope at 1 dte. that's wednesday (today) and it's fed day so that distorts the curve. but that doesn't mean the front end doesn't slope a lot more than the deferred expirations. all this means is that the iv change of a 5 day difference in expirations can vary more than you want. the other thing to note is on the lower graph the change in iv across strikes varies a lot. again, ignore the kink at the money, that's not real, it's just a result of schwab's inaccurate iv calculations. imagine the curve to be smooth.

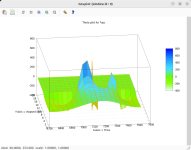
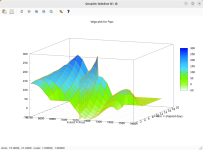
i plotted a 3d graph of theta and vega. this varies both time and price, but it also assumes a constant iv change over that period, and that's not the case, but that's a limit of not being able to predict volatility. the thing to note on the vega chart is that this trade has a very complex iv profile. much more complex than a straight calendar or credit spread. what this means is that your neutral iv will not stay neutral. the vertical slice in the middle of the graph is an attempt to show the current spx price. the 3d graphs are interactive but of course, you can't do that on a screenshot. i don't have a video capture program on this computer but if you have problems interpreting the graph i can install one and capture a video as i rotate the graph.

marcas mentioned the horrible risk/reward. that struck me the same. i like butterflies and calendars because they have better risk/rewards and that leaves room for adjustments without killing the trade. have you had to do adjustments for this trade? iv.pngspx_may8_xw_theta.pngspx_may8_xw_vega.png
 
Thanks for your insight guys! First, Jim, let me ask what software you use to generate these graphs?

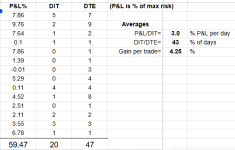
Second, performance: I've done 14 of these 4XW trades since 27 Feb. 13 were winners and 1 lost $0.49. That loss was 10 days into Iran war & I changed my mind soon after I opened it. I do realize that balancing positive and negative vega is a high level concept, not a fine tuning knob, but it seems to steady the boat. My goal is safe income at ~1% (of max risk) per day. So far this works. Here's a summary:

% P&L per day
% of days
%
[td]
P&L%
[/td][td]
DIT
[/td][td]
DTE
[/td]
[td]
(P&L is % of max risk)​
[/td]
[td]
7.86​
[/td][td]
5​
[/td][td]
7​
[/td]​
[td]
9.76​
[/td][td]
2​
[/td][td]
9​
[/td][td]
Averages
[/td]
[td]
7.64​
[/td][td]
1​
[/td][td]
2​
[/td]​
[td]
P&L/DIT=​
[/td]​
[td]
3.0
[/td]
[td]
0.1​
[/td][td]
1​
[/td][td]
1​
[/td]​
[td]
DIT/DTE=​
[/td]​
[td]
43
[/td]
[td]
7.86​
[/td][td]
0​
[/td][td]
1​
[/td]​
[td]
Gain per trade=​
[/td]​
[td]
4.25
[/td]
[td]
1.39​
[/td][td]
0​
[/td][td]
1​
[/td]​
[td]
-0.01​
[/td][td]
0​
[/td][td]
3​
[/td]​
[td]
5.29​
[/td][td]
0​
[/td][td]
4​
[/td]​
[td]
0.11​
[/td][td]
4​
[/td][td]
4​
[/td]​
[td]
4.52​
[/td][td]
1​
[/td][td]
8​
[/td]​
[td]
2.51​
[/td][td]
0​
[/td][td]
1​
[/td]​
[td]
2.11​
[/td][td]
2​
[/td][td]
2​
[/td]​
[td]
3.55​
[/td][td]
3​
[/td][td]
3​
[/td]​
[td]
6.78​
[/td][td]
1​
[/td][td]
1​
[/td]​
[td]
59.47​
[/td][td]
20​
[/td][td]
47​
[/td]​

Many of these were very short term experiments that I will probably stop. Too harrowing managing expiration day! Probably won't do less than 4DTE going forward. This will push the daily P&L% lower but I'll be quite happy with 1%. This is a tiny sample & clearly need a lot more experience but so far I'm happy with it. Comments & suggestions welcome.

I spent about a year fooling around with various 5 strike, 4 strike, and 3 strike formats, all featuring low net vega & wide between BE's. Low initial gamma comes naturally with this setup. The 5 strike and 4 strike versions both worked well but I'm finding the 4 strike version is much easier to enter, exit, and manage in between.
 
the iv plots are from a web app that i wrote. the surface plots are from gnuplot, a free graphing program. the data for the surface plots was generated from my options analyzer program. btw, your html table doesn't format correctly when i view your post. i don't know if it's my browser or some other thing.
 
Bill, re. table.
I’m surprised how well you did with XW.

My first thought was that you were just lucky, that the market happened to cooperate, but then I looked at the chart and that period was not XW friendly. Maybe I’m wrong in my assessment (which I type below) of the trade? Or maybe surprise come from a fact that I was think about structure and you were actually trading the trade (qualifies entries, robust adjustments, etc.).

I have some doubts abut the table, not sure if I’m reading your numbers correctly.
You put, say, 10K in each trade and after 2 months you are up to 16K – those are excellent returns for an option strategy. Ofc data are very limited and no general conclusions can be drawn, nevertheless you are a very good trader. But what DTE column means? Is it a dte for shorter cycle at entry or is it a mark of exit time? Some rows are interesting and ask for detailed analysis. Gladly will look at those myself but I don’s ask you to publish your trades. If you didn’t do so yet, review those trades in detail with ONE or whatever you prefer.
You did a good job with XW, that’s obvious.

My take on XW (without considering results. a structure analysis only)
Disclaimer first. Some people take words of critique of their trades as personal attack. I do not think you are there but just in case: my goal is to use yor example as a starting point of a discussion and as opportunity to learn and exchange opinions/observations. I do not pretend that I know everything nor that what I say is correct (although I think so). I really do appreciate other perspectives and opinions but I expect them to be supported with some substance.
Repeating: I appreciate your sharing.

XW:
I look at it differently from Jim. I mean, I use different approach when analyzing.
I divided XW into smaller pieces nad looked at those in separation and how they work together.
I created 3 parts, when you combine them you get exact the same fraph as yours. (It can be done in different way, but this is the simplest for me to wrap my head around).
Mind that I did not go into trouble of figuring out exact prices for each part but rather guestimated them – exact prices are not important though.

Part 1 – Asymetrical Iron Condor:

SELL -1 2/-2/1/-1 CUSTOM SPX 100 (Weeklys) 8 MAY 26/8 MAY 26/8 MAY 26/8 MAY 26 7350/7370/7070/7030 CALL/CALL/PUT/PUT @12.75 LMT

This is main driver of the setup. It belongs to CF (Condor Family) with all that comes with that: it likes to be put in high vol in certain skew, likes vol to drop etc.

Part 2 is short Put Vertical:

SELL -1 VERTICAL SPX 100 (Weeklys) 8 MAY 26 7030/7025 PUT @1.00 LMT

As Part 1 leans toward put side (on SPX, effect of skew), short put vert adds tint of bullish bias – SPX suppose to move up more than down, so no problems here. Although, the vert is tiny in comparison to IC and can be, imo, omitted without changing the trade a lot.
Short vert also adds risk to downside.

Both parts together create ~Cockroach trade, that often can be traded as stand alone structure. This one (again, I guess prices) is not particularly appealing.

There is big risk on call side. Risk is far away and not likely to be in danger, but it is not a no-risk situation (somebody was willing pay us to hold it). Even so, if trade was put in high vol then on run up vol likely decrease (unless we have melt-up move) which will help our position. Then we have bunch of defensive moves in disposition. Taht said, the call side risk is still to high for my liking.

Put side. Situation is worse. Risk is bigger. Rising vol may help a bit but not much. Put side is in real trouble in fast in crash scenario.

To help/mitigate put side situation we are adding a calendar.

Part 3: Callendar

BUY +1 CALENDAR SPX 100 (Weeklys) 13 MAY 26/8 MAY 26 7025 PUT @13.65 LMT

For me it is a questionable decision. Sure on paper, in simulation rather (poor simulation I may add), it looks good – extended downside breakeven, fixed vega (seemingly), more theta.
(Btw. wide break-even span can be used as a selling point but for me it doesnt matter much. Bc of big risk I suppose trade need to be adjusted way before getting close to either break-even point.)

With calendars all things belonging to calendars come in. While CF’s theta is more or less reliable, then cal theta is not. Vega is also fake. It may work though, especially if we are close to expiration, but it also may not, and if it doesn’t work (likely, but I did not do any statistics on that) it will add salt to our wounding trade when calendar’s graph sinks and does not give us promised protection. Also dte gap of a clendar counts. Small gap – better vega perspectives but less, or no, rolling opportunities (I guess in XW this is not an issue).

And calendar does not help in up moves neither.

Downside risk is what I afraid the most with XW.

That’s how I see it.
I presented a narrative (description of XW) that I like, but other stories can be told as well (for example a story with a calendar as a main driver).

Now, I must confront my story with real life results, which are better thatn I’d expect, particularly in market we had in last 2 moths.
Of course I do not know details and am making assumptions but final result: being up 50%, is a story in itself.

Would I trade XW? … maybe… but I would make sure I have enough time to babysit it and I would not put any serious money into it.
I think that trading XW, small, can give a trader great opportunity to study the market and the trade itself. I would not recommend it, even with stellar results, to a trader who does not have ability to quickly adjust in case XW goes against him.

Well. actually I was not talking about XW trade but XW structure. There is a difference.
 
Last edited:
Sorry about the pic - was a copy/paste from Google Sheets. Here's a screenshot
Those are great results! Especially for the intra day trades (DIT = 0). Did you open them as one order? Or did you leg in?
In my calendar trades (usually around 14 DTE) I only see very little movement from day to day. But that could also be the longer duration.
 
bill, do you have a favorite adjustment or do you just close it and start over? my model is showing some stress. delta it way too negative. it was up 5% yesterday so i should have closed it. it still shows a small profit.
 
a follow up to my earlier calendar trade. this is the trade 10 days later. this one has been a struggle making profits. the vega is very high for these trades and the drop in iv took a toll on this one. it's only up 15%, which is low for this many days in the trade. when i entered it in etrade paper money i lost $85 in slippage. i would expect a similar amount getting out. i haven't tried closing it yet but will in a day or so.
spx_may8_surf_2.png
 
I would be interested in post mortem analysis, if you make one, after finalizing the trade.
This is to complicated for my abilities but can serve as a study object.

I entered a single calendar trade about week ago or so (dont have platform open). FOr all that time it was flat or slightly under water. Yesterday it showed few dollars profit but again went down today - slightly. That a calendar for you... but I start liking them more and more :)
 
marcas wants a postmortem so this will have to do since i ran into technical problems with etrade that prevented me from oclosing it properly. there were issues with fills and i also broke the platform with all the cancel-replace orders. while trying to close deep in-the-money calendars i wasn't able to get fills. since etrade only fills when the limit hits a price of an actual spread trade, if the strikes don't trade while i'm trying to close a spread i will only get filled at the market price. since these spreads were over 140 points in-the-money, the bid/ask spreads were over 3 dollars. i tried many cancel-replace orders and one got stuck in the pending cancel state and i couldn't replace it. after that i could only use the mid-prices that my model uses. that was clearly not going ot be accurate. so from that point on, the results of the trade weren't going to be meaningful.

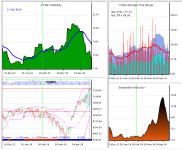
this trade was not a good one. the big up moves and the big reduction in iv destroyed the trade. during my efforts to try to close some of the calendars the draw-down was over $1000 and more than 23% of the max loss. under real trading scenarios i wouldn't let the loss get this large, but i wanted to see if i could salvage the trade even though it wouldn't reflect actual results. i started closing the put calendars first to try to fix the delta. the call calendars became way too deep in-the-money. i can't let that happen in the future. i don't know what to do about it yet, i have to experiment with it. i ended up adding another call calendar above the money and closed the lower ones. this morning it was showing a loss of $298 based on my mid-prices, but in actuality that would be significantly worse. i have saved the state at different days but i won't post them because after may 5th they're based on mid prices. i have attached the spx price graph as well as some indicators i monitor. the price graph shows the break-even prices and a volatility cone overlaid on it since the start of the trade.

this trade has lost some of its luster, but i haven't completely given up on it yet. i need to do a lot more paper trades before i put real money in it. if anyone has some real experience closing very deep in-the-money spx spreads i'd like to hear what
the outcomes were relative to mid prices.

may8_surf_charts.png
 
Top
Contact Us