Implied volatility of option expirations

status1

Well-known member
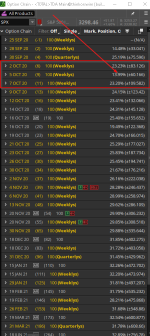
I was wondering how is the implied volatility calculated for the option expirations on SPX I am refering to the numbers on the right side of each expiration on TOS on the trade tab there is a number in a percentage and another number next to it in paranthesis I assume that is the expected market move for that expiration

I noticed for the Oct 9 expiration the IV shows as 13.99% while the expiration before and after Oct 2 and Oct 7 is around 23%
Seems like there is a big difference
I was wondering if that is real IV or just a mistake and if there is a possible edge there that can be exploited
 
I think you meant the OCT 5th expiration which is 9 DTE (instead of Oct 9th expiration). Regarding the derivation of those numbers for the IV %. It fairly closely matches the derivation used in the VIX White paper for the respective expiration for larger DTEs. Larger DTEs match that derivation to fairly tight precsion. Smaller DTEs (< 14 days) the equations diverge some. I asked them if they used the same computation approach as detailed in the CBOE VIX white paper and was told yes (I suspect that response was not really accurate). However, it must be a proprietary equation they will not disclose. (for most purposes, I think it kinda tracks the VIX White paper algo (biased to the OTM PUT IVs)

I would take those numbers for DTE <14 days with a grain of salt!
I just looked briefly and do not observe any option pricing to justify that value for that series! -- however If they include volume in their derivation (the VIX white paper method does NOT use volume), perhaps the 8,000 2750 PUTs trades is affecting their value! {I'm just guessing, as this volume is relatively excessive}
1601151277080.png
 
Thanks for catching that
Yes I meant the 5 Oct expiration

Normally I don't look at the IV of the expiration
I have been playing with calendars and diagonals and I noticed that for some reason if I sell the Friday and buy the following Monday expiration the calendar is about twice as cheap as any other combination so I was tying to figure out why that is I thought maybe I found something but that doesn't really explain it because I can go further out and sell the 30 Oct and buy the 2 Nov which has an oppsite Iv but it's still cheaper than any other date combination
So I am not really sure what it is about the weekend calendar that is cheaper than anything else
 
Side question.
Gary I'm amazed of number of series you can capture on the picture. Can you tell something about your monitors arrangement? Do you have monitors in vertical orientation?
 
Side question.
Gary I'm amazed of number of series you can capture on the picture. Can you tell something about your monitors arrangement? Do you have monitors in vertical orientation?
The monitors are in standard landscape orientation.
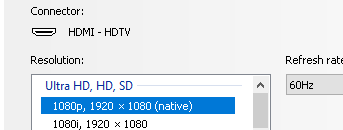
That monitor resolution is:
1601166387673.png

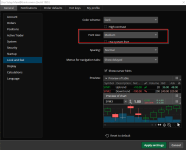
My TOS video size:
1601166602846.png
 
Thanks, I have very similar setting. The reason of my amazement must be that I don't look at chains in Trade Tab (even not detached) but in Analyze where there is positions widow present covering bottom part of the screen. How much do I get used to my setup/workflow that simple things like that impress me! Thanks for sharing, if this allows me to put trades from chain to Analyze without need for switching tabs - it will become my setup also although I keep number of open window at minimum.
 
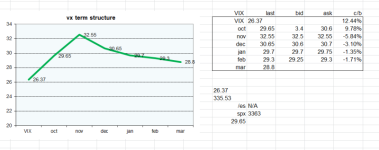
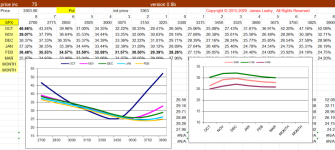
in a related topic, how do we reconcile the apparent difference between the spx volatility constellations for the future months and the vix term structure. looking at the volatility
curves for spx, there doesn't seem to be an unusual volatility bump in november, like there
is in the vix term structure. think or swim's option series iv calculations also don't show anything unusual. i agree the election in november represents a "binary' event that will
cause uncertainty, but it doesn't show that in the volatility curves. i would have expected
the november curve to be above those of the subsequent months.
vx_term.pngspx_constellation.png
 
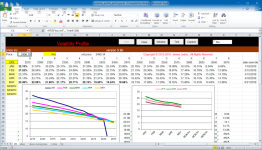
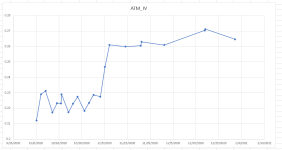
Here is what I observe with the SPX ATM_IV terms taken at 4PM Eastern today. Each dot is the respective Expiry. The relationship with that of the /VX term structure It is a bit puzzling.
1601533466714.png
 
Jim, everything is fine with IVs.
November and December vols are elevated - the skews for those months are shifted up, ie. they are higher on the graph then they would be if no event was on horizon. VIX is calculated from the whole chain/chains. The VIX futures 'hump' does not indicate that Nov skew should be above/below Dec or Jan (although it can). So there is hardly anything to 'reconcile'.
I didn't see a good plain explanation of this subject. Some presenters understand it naturally and don't want to waste time explaining obvious, others don't get it and (without bad intentions, I'm sure) imply, at least, wrong understanding. We had example of the later recently.
Just pause for a sec and think what skew is and what vix is and what those numbers are telling.
The burning question is how to position ourselves to take advantage of this situation .
 
Last edited:
The VIX futures 'hump' does not indicate that Nov skew should be above/below Dec or Jan (although it can). So there is hardly anything to 'reconcile'.
my reasoning for this is based on my assumption that the market is setting
up for a binary event in november. i'm comparing this with other binary events
i'm very familiar with, namely, quarterly earnings. in the weeks, days preceding
earnings, the vols in several option series that expire after the earnings date
start rising. the effect extends much farther out in time than you would expect,
but each subsequent expiration rises by an exponentially decreasing amount. if you
look at the volatility profiles of these stocks, you will see the curve of the front expiration rise
above the subsequent ones. this happens in virtually all stocks, or at least,
all the ones i trade. after the earnings release, the vols usually quickly
return to normal. this is the vol profile for aapl. earnings are on nov 4th.
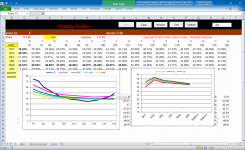
aapl_oct_vol.png


as far as the vix futures hump in november is concerned, while there is no
fair value that can be calculated for the vix futures, it is a bet by traders
of the expected value of the vix at expiration (the vix futures settle to
the value of the cash index). the term structure indicates a similar behavior
to an earnings situation, with the expected value of the vix to fall after
the binary event.

i realize, also, that the spx iv value of any strike can't be calculated
from the vix, but implied volatilities and the vix are correlated.
http://blog.harbourfronts.com/2019/03/28/differences-vix-index-money-implied-volatility/

just for background information, i looked at the 2016 election binary
event, and it didn't set up like the current one. the vix futures term
structure was in contango, and the volatility profile was also very different.
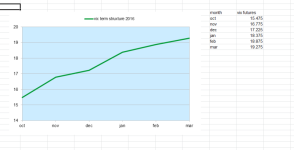
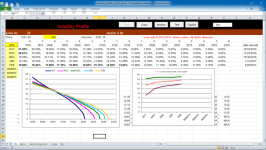
vix_term_2016.png
spx_vol_oct16.png


and for completeness, i looked at the vol profile the last time the vix futures
were in backwardation, jan 2019. you can see that the vol curves indicate
a falling iv in subsequent months.
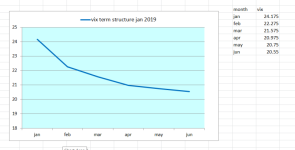
vix_term_jan19.png

spx_vol_jan2019.png

as far as how do we position for it? one of the ways i trade earnings is to sell
high volatility and buy low volatility as a diagonal spread (weighted vega
in action). this limits risk, but you have to pick a direction. you can
generally handle a 1 standard deviation move against your assumed direction
but you'll have to wait to see how the volatilities resolve before the election.
there's currently not enough differential in the months to do this trade.
 
Jim, very nice piece of software you have. Work you do is important and can give us some guidance but I can't help you with decoding IV's in a sence what will happen or what IV's think it will happen. I think nobody can do that in a fully objective manner.
I don't use IV examination in my trading, not that they are no good but rather I can figure it out how to read them in my trading practice. I belive there are more knowledgeable traders here to discuss skews and backwardations.
 
Last edited:
Top
Contact Us