options risk graph using excel

jim leahy

Active member
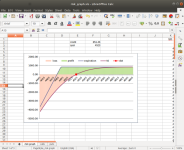
a few people expressed interest in implementing a risk graph in excel. my previous implementations use
visual basic, but i explained to some how it can be done w/o software. i found a spreadsheet on the web,
called "Options Greeks Calculator.xls", that uses only excel functions to implement the black-scholes model.
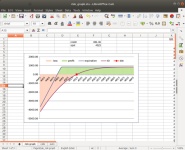
i modified this to create a risk graph. it's a fair amount of work to model butterfly or condor and not nearly
as flexible as a software model, but it can be made to work. i modeled only a single put, but following this example,
it will be possible to add more strikes. all of the parameters are constants but can easily be replaced with rtd links
or variables. if you use this spreadsheet, reply to this thread and tell us what you've done with it, and perhaps
share your modifications with the community. below is a screen capture of the graph and the spreadsheet is attached.
1630448111067.png
 

Attachments

  • 1630447963351.png
    1630447963351.png
    170.1 KB · Views: 19
  • risk_graph.xls
    risk_graph.xls
    86 KB · Views: 48
Looks interesting but I imagine it's not very accurate I tried to make one a while back but I could never get it good enough to be of any use
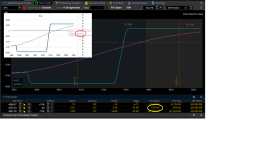
Between the risk free rate and the volatility of each strike I could never get anywhere near the TOS p/l values
Even the Lookback at Tastyworks is just a math model so yes you have an idea of what the risk graph looks like but to make any trade decision or look at the p/l and have any real value I find it difficult to find anything better than TOS

I will play around with it to see if I can make any use of it
 
I was wondering about the calculation of d1 in your excel spreadsheet
=LN((E3/$F$2))+((($C$20-$C$23)+(POWER($C$21,2)/2))*$C$22)
It seems that the LN is calculating the entire expression based on the parenthesis placement

The way I saw it was more like this =LN(E3/$F$2)+((($C$20-$C$23)+(POWER($C$21,2)/2))*$C$22
So the LN is only calculating the SPX price divided by the strike price and the rest of the formula is added to the result

Not that it makes any difference because either way it's not going to match the option price I just wanted to make sure that I am using the correct formula
 
you don't have the complete formula and you've removed the outer parentheses and 1other parenthesis after
$c$22 so i'm not sure if that's what you meant to do. other than that, you've removed a redundant set of
parentheses surrounding the ln(e3/$f$2). if you really meant to remove the outer parentheses then the resultant fair value for the spx price of 4445 of the 4490 strike, with 6 dte, is equal to 1299, vs 52 using the formula unchanged. comparing this to thinkorswim and other analyzers, the 52 value is about the fair value that they
calculate. i suggest you make your formula changes and substitute them in the spreadsheet and you will be able
to compare the results with what the original formula produces.
 
Yes I have removed that to make it a little simpler to view with all the parenthesis
Here is the complete formula =(LN((E3/$F$2))+((($C$20-$C$23)+(POWER($C$21,2)/2))*$C$22))/($C$21*SQRT($C$22))
so removing the /($C$21*SQRT($C$22)) does not change the formula as far as the parenthesis is concerned because that is just the divisor so you are left with (LN((E3/$F$2))+((($C$20-$C$23)+(POWER($C$21,2)/2))*$C$22))
Than I removed the outer parenthesis as that is just to make the entire formula be divided by the divisor so I am left with
LN((E3/$F$2))+((($C$20-$C$23)+(POWER($C$21,2)/2))*$C$22) which is what I started with in my first reply so that still does not change your formula

After that I mentioned in comparison how it would look if only the LN(E3/$F$2) was calculated and added to the rest of the formula
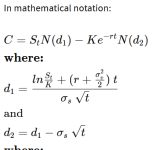
I am only questioning it because when I look at a Black Scholes formula I always see it as shown in the attachment
As you can see there is no parenthesis after the ln so the ln is calculated only for the S/K not for the entire formula
If your formula is correct than all the Black Scholes formulas I have seen are wrong or this is just another version of it
 

Attachments

  • d1 formula.PNG
    d1 formula.PNG
    18.4 KB · Views: 1
After looking at the formula more closely I think I found the problem here is the original
=(LN((E3/$F$2))+((($C$20-$C$23)+(POWER($C$21,2)/2))*$C$22))/($C$21*SQRT($C$22))
and here is the corrected version

=(LN(E3/$F$2)+(($C$20-$C$23)+(POWER($C$21,2)/2))*$C$22)/($C$21*SQRT($C$22))
I removed the 2 extra parenthesis )( before and after the + after the $F$2 and one before the E3 and another after *$C$2
It does not change the result but it looks like a BS formula now It just did not looked right to me with all those extra parenthesis
 
the resultant fair value for the spx price of 4445 of the 4490 strike, with 6 dte, is equal to 1299, vs 52 using the formula unchanged. comparing this to thinkorswim and other analyzers, the 52 value is about the fair value that they
calculate
Hmm...
I am not sure how this is correct
Not sure what this 52 value represent because it's not even close to any put value nearby Maybe I have some settings wrong or I am looking at the wrong thing

The current value is around 4535 and looking at the 8 Sep 6DTE and the 4535 strike on the put side the Mark is at 17.90

On the spreadsheet I entered 4535 for the strike and the value and 6DTE and I am getting a put price of 21.14
so that is better than 52 but still not close to 17.90

Is there something I am missing ? Do I have to change the volatility ? I left that alone at 10
 
I'm actually working on my own version of a similar sheet that will calculate the expiration and t+0 lines. Not near ready enough to share but I did put together a tab detailing the Black Scholes calculation. I have actually converted it to a VBA user defined function to keep the numerous modeling calcs a little more manageable. I've just attached the straight calcs. So this may help you guys out.
 

Attachments

I also started out with Macroptions and made a graph but as I mentioned I could not get it to be accurate or even close to TOS values

I imagine most of that has to do with the volatility input and since that is a variable even if you get it right for the put option the call option will be a little off and than a second later the volatility changes and than the result is off altogether so that is why I pretty much given up on it but if you think you can come up with anything close to TOS values I and probably many others would be interested in it

Maybe the Black Scholes formula works better for stock with low volatility where you could enter a value and have a close enough option price but I have not found anything that would give a close result for SPX
 
You can try to model options your entire life...but in reality (UNLESS YOU ARE A MARKET MAKER) you will always find what is offered in the market(BY THE MARKET MAKERS!!!!!!) you better off spending time learning Golf or play the piano........
 
I also started out with Macroptions and made a graph but as I mentioned I could not get it to be accurate or even close to TOS values

I imagine most of that has to do with the volatility input and since that is a variable even if you get it right for the put option the call option will be a little off and than a second later the volatility changes and than the result is off altogether so that is why I pretty much given up on it but if you think you can come up with anything close to TOS values I and probably many others would be interested in it

Maybe the Black Scholes formula works better for stock with low volatility where you could enter a value and have a close enough option price but I have not found anything that would give a close result for SPX
IMHO: If you seek precision in the results, one should not guess at the input variables, such as volatility. You may find discrepancies in values produced by different presumed reliable sources. For volatility input, you may wish to use BSM iteratively to find what the volatility actually is/was! -- Most use Newton Raphson method for this. All inputs to BSM must be correct if you desire to extract correct results. Garbage In Garbage Out.
 
I am curious how this Newton Raphson method is used for this calculation

If this is required to calculate the option price than why is anyone bothering to show how they use the Black Scholes model without it ?
Is it just to show some random meaningless option value ? Or just to show how the risk graph looks ?
 
I am curious how this Newton Raphson method is used for this calculation

If this is required to calculate the option price than why is anyone bothering to show how they use the Black Scholes model without it ?
Is it just to show some random meaningless option value ? Or just to show how the risk graph looks ?
I hope this is clear: -- Others are much better at explaining things than I am.
This may help: "https://www.risklatte.xyz/Articles/QuantitativeFinance/QF135.php"
However, I personally use a binary search algorithm to terminate after achieving my precision requirement. (to me is simpler and more quantifiable in time and results)

In a nutshell: Most inputs to the BSM are fairly easy to determine or estimate to the precision you may require, except for the Volatility input. Most literature on the volatility input to the BSM is "tainted" to reference volatility of the underlying instead of implied volatility, which is unique for each strike. If you know all other inputs (option price, underlying price, time to expiration with adequate precision, proper annualized interest rate for the term/instrument, and proper handling of impact of Dividends, then you only have the "implied volatility" as the missing value.
If you provide the proper value for the implied volatility (and all other parameters are provided correctly), the resulting option price will only MATCH the correct price if you provide the correct Implied volatility value. There are various methods to "solve" for implied volatility, once all other parameters are known. One of these methods is the Newton Rapson method. Basically use BSM in a loop, varying the test value for Implied Volatility until the correct option price is found! -- Then, use this value as the Implied Volatility for that specific option for that point in time!

IF you prefer Python AND the IIV of your target is <500%, this may be more intuitive (the code I use for solving for IIV with BSM). (Binary search method)

def ResolveIV(call_flag, S, X, A, T, r, iv, q):
high=5
low=0
precision=0.0001
while ((high - low) > precision):
IVTrial=(high + low)/2
if (IVTrial < 0.00001):
return((high+low)/2)
TheoPrice=BlackScholes(call_flag, S, X, T, r, IVTrial, q)
if (TheoPrice > A):
high=(high+low)/2
else:
low=(high+low)/2
return((high+low)/2)
# end def ResolveIV
---------------------------
The BSM below for completeness:
def BlackScholes(call_flag, S, X, T, r, v, q):
assert S, "Must specify S"
assert (X and v and T),"Missing values passed to BSM!"
d1=(math.log(S/X) + (r-q+(v**2)/2)*T) / (v * (T**0.5))
d2= d1 - v * T**0.5
if (call_flag):
return (S * math.exp(-q * T) * CND(d1) - X * math.exp(-r * T) * CND(d2))
else:
return (X * math.exp(-r * T) * CND(-d2) - S * math.exp(-q * T) * CND(-d1))
# end def BlackScholes

def CND (x):
Pi=3.141592653589793238
a1=0.319381530
a2=-0.356563782
a3=1.781477937
a4=-1.821255978
a5=1.330274429
L=abs(x)
k = 1/( 1 + 0.2316419*L)
cnd = 1 - 1/(2*Pi)**0.5 * math.exp(-L**2/2) * (a1*k + a2*k**2 + a3*k**3 + a4*k**4 + a5*k**5)
# then return the appropriate value
if (x >= 0):
return (cnd)
else:
return(1-cnd)
# end sum CND
 
I also started out with Macroptions and made a graph but as I mentioned I could not get it to be accurate or even close to TOS values

I imagine most of that has to do with the volatility input and since that is a variable even if you get it right for the put option the call option will be a little off and than a second later the volatility changes and than the result is off altogether so that is why I pretty much given up on it but if you think you can come up with anything close to TOS values I and probably many others would be interested in it

Maybe the Black Scholes formula works better for stock with low volatility where you could enter a value and have a close enough option price but I have not found anything that would give a close result for SPX
I've actually gotten decently close to TOS values. You have to pull in the individual IV's of each option and run the calculation for each individual option across the axis in the black scholes equations. I do this with the rtd function in excel and import from TOS. I don't try to derive IV.
 
In a nutshell: Most inputs to the BSM are fairly easy to determine or estimate to the precision you may require, except for the Volatility input.
Not necessary. There are time inputs are fairly easy to estimate (where 'easy' is fairly relative term) and times they are not. The simplest (?) example of that is price. It is not a trivial to find true price of an option and if you do, the next second that price can be different thus your precise number will change. Each single input can be questioned, even underlying's price and dte :)
I don't say that modeling is useless - there are situations models are necessary, but for average or even advanced retail trader learning piano is indeed much better use of time (also IMO and providing they already use some modeling, likely done by trading software).

That said, I suspect it is almost unavoidable for each trader to attempt to find an edge in better modeling (better than whatever) - at least for drawing a "better t-line" :D ).
With that assumption code provided by Gary can be a good starting point for novice in modeling and huge time saver. There are also available, ready to use, BSM implementations codes for Excel. Each have to decide how deep one wants to go down this rabbit hole. There is no bottom there.

In my trading I presently use TOS' calculations, knowing they are 'wrong'. I'm ready to take tirades how ridiculous my approach is and what disadvantage I have. I'm all ears, I can be wrong.
 
Basically use BSM in a loop, varying the test value for Implied Volatility until the correct option price is found! -- Then, use this value as the Implied Volatility for that specific option for that point in time!
Thanks for the explanation
I figured it was something like that Basically is kind of like a guessing game I can do that manually
The thing is that in order to do that you need to know the correct option price so at that point you are not using the BS to find the price you are using it to find the Implied Volatility which kind of defeats the purpose of using the BS to find the option price

The bottom line is you can't use the BS to find the option price without the volatility value and you can't find the volatility value without knowing the option price
 
I've actually gotten decently close to TOS values.
Just curious what you mean by close or how close are your values ?

Somehow I am not getting close enough if I use the IIV that is on TOS
Just a quick example if I use the SPX 6DTE and 4535 strike with the closing price of 4535.43 I get a put option price of 17.31
That is using it with the 7.57 IIV from tos The Mark or Theo price on TOS is 17.75
So I guess you could say that is close

I like to get it almost exact so after substituting some values I come up with 7.76 for IIV which gives me 17.75
 
Thanks for the explanation
I figured it was something like that Basically is kind of like a guessing game I can do that manually
The thing is that in order to do that you need to know the correct option price so at that point you are not using the BS to find the price you are using it to find the Implied Volatility which kind of defeats the purpose of using the BS to find the option price

The bottom line is you can't use the BS to find the option price without the volatility value and you can't find the volatility value without knowing the option price
Agreed! If you think about it, My approach is to establish current or past information using valid data, solving for IIV given the option prices. If one does that process correctly, then that can be used to determine what-if effects with amazing accuracy (if you are off by one penny, then you have an error or bad rounding somewhere). For example, if you know all BSM inputs for now, then you can easily create the T+0 line, which ASSUMEs the only variable change is the underlying! For this, most assume sticky-strike, which assumes the volatility for this T+0 does not change for the options. (Some tools, such as OV and ONE have other volatility implementations that can be enabled that will assume volatility may change, but TOS and OV EIOIO assume volatility on T+0 is locked. Once you begin to alter time (say T+n. Then assumptions about sticky-strike for IIV get unreliable as you are predicting volatility will NOT change, which we all know is silly. So, if you can predict what the IV at each Underlying price will be in the future, you could just plug those into BSM, (with all other inputs reflecting that point in time), and the option price of BSM output will be spot on! --- The issue is not BSM, it is we don't know in advance the IV at Underlying for all points in the future (two unknows (if we ignore skew changes), not one) [Interesting our X-Axis on our PNL risk graphs are missing volatility, which is a variable as well.
It seems prudent to assume future volatility projections will be imprecise.
 
"Predicting " the Volatility is the same as predicting the price of the underlying asset in many ways........
then why not just buy a crystal Ball from Amazon.
Or overfitting like crazy and hope that the past will be repeated in the present and future!

Happy trading
 
Top
Contact Us