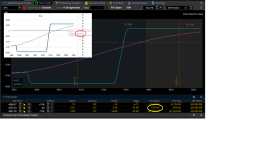
a few people expressed interest in implementing a risk graph in excel. my previous implementations use
visual basic, but i explained to some how it can be done w/o software. i found a spreadsheet on the web,
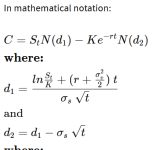
called "Options Greeks Calculator.xls", that uses only excel functions to implement the black-scholes model.
i modified this to create a risk graph. it's a fair amount of work to model butterfly or condor and not nearly
as flexible as a software model, but it can be made to work. i modeled only a single put, but following this example,
it will be possible to add more strikes. all of the parameters are constants but can easily be replaced with rtd links
or variables. if you use this spreadsheet, reply to this thread and tell us what you've done with it, and perhaps
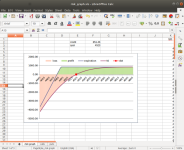
share your modifications with the community. below is a screen capture of the graph and the spreadsheet is attached.
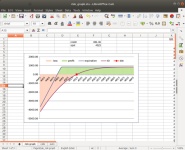
visual basic, but i explained to some how it can be done w/o software. i found a spreadsheet on the web,
called "Options Greeks Calculator.xls", that uses only excel functions to implement the black-scholes model.
i modified this to create a risk graph. it's a fair amount of work to model butterfly or condor and not nearly
as flexible as a software model, but it can be made to work. i modeled only a single put, but following this example,
it will be possible to add more strikes. all of the parameters are constants but can easily be replaced with rtd links
or variables. if you use this spreadsheet, reply to this thread and tell us what you've done with it, and perhaps
share your modifications with the community. below is a screen capture of the graph and the spreadsheet is attached.

 ).
).