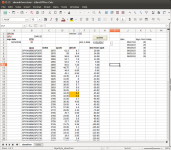
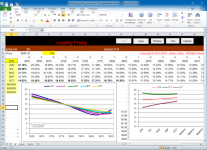
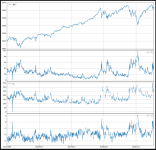
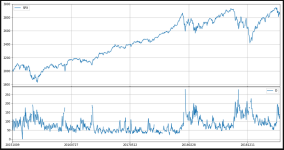
I watched the most recent Trading group meeting where there was a discussion on the Skew Driver spreadsheet
From what I understand this is used to determine if the market is overbought or oversold
Is there any reason why the $5 was chosen as the place to look at ?
Is that because it's 1/4 of the $20 wide spread or no particular reason just experience perhaps ?
Also what about the 30 days ? Is it because the vix is measured at 30 days or no particular reason ?
Is there a certain relationship between the price of the spread the spread and the DTE ?
I was wondering if it would be worth it to modify it for one week to determine what would be a good entry price for a weekly put spread That would be a lot more useful to me anyway
This gives me an inspiration to try to make a spreadsheet and see if I can use it for my trading
From what I understand this is used to determine if the market is overbought or oversold
Is there any reason why the $5 was chosen as the place to look at ?
Is that because it's 1/4 of the $20 wide spread or no particular reason just experience perhaps ?
Also what about the 30 days ? Is it because the vix is measured at 30 days or no particular reason ?
Is there a certain relationship between the price of the spread the spread and the DTE ?
I was wondering if it would be worth it to modify it for one week to determine what would be a good entry price for a weekly put spread That would be a lot more useful to me anyway
This gives me an inspiration to try to make a spreadsheet and see if I can use it for my trading
Last edited: