Skew Driver

status1

Well-known member
I watched the most recent Trading group meeting where there was a discussion on the Skew Driver spreadsheet
From what I understand this is used to determine if the market is overbought or oversold
Is there any reason why the $5 was chosen as the place to look at ?
Is that because it's 1/4 of the $20 wide spread or no particular reason just experience perhaps ?
Also what about the 30 days ? Is it because the vix is measured at 30 days or no particular reason ?
Is there a certain relationship between the price of the spread the spread and the DTE ?

I was wondering if it would be worth it to modify it for one week to determine what would be a good entry price for a weekly put spread That would be a lot more useful to me anyway
This gives me an inspiration to try to make a spreadsheet and see if I can use it for my trading
 
Last edited:
No reasons were given for 30-days or the price of the put spread. I suspect it's just experience for the price and the 30-days is likely to approximate a measure similar to the VIX.

It's probably worth testing with different time frames
 
I think there is reason for $5 and 30 dte. Those are parameters Scott utilizes as entry parameters for one of his trades.

This is practice used by many traders, for example JL looks at prices of his butterflies for entry, Ron Bertino use the same technique for monitoring some of his trades (see Round Table STT presentation), I've seen others using it for their trades.
One can change spread price, width and dte to match his favorite trade.

Basically this is monitoring of PutSkew (or PutSurface rather) in selected location, as opposite to monitoring whole thing. Very practical.
 
Thanks for the replies
I made the spreadsheet
Now I guess it's up to me to determine what is a good entry point
Just from yesterday to today the market went up 34 points but to get the same price for the spread I had to move up 50 points. I did not make a note on how close it was to the ATM but I think it was about 130 and now it's at 110
which is still 2 STD away so I would think it's a good entry point if no disaster happens over the weekend
 
My 1/2 cents: From the limited information I have observed... the "SKEW Driver" is a measure of SKEW slope (left lip angle of the smile) at 30 DTE (ie... impacted by SKEW slope). The SKEW slope is higher at shorter DTE than at longer DTE. Choosing 30DTE allows a more consistent representation, without having to compensate for the natural impact of time variations. From "the nature of the beast", I would think the "oversold" interpretation may be more reliable than the "overbought", however I have not studied it. -- Typically, the SKEW slope shrinks in periods of high fear, but will revert once the fear subsides.
 
That's all well and good but how does this help a trader make a decision whether it's safe enough to place a trade ?
I would imagine it would be difficult for a trader to place a trade based on a certain slope angle
The spreadsheet would be a lot easier if one knows the level at which a trade is safe to place
I am doing it on the SPX weekly so I can't use Scott's spreadsheet so I am just doing it on my own real trading experience
 
That's all well and good but how does this help a trader make a decision whether it's safe enough to place a trade ?

Instead I propose to use paper trading as safe place. It's much better than being on the slope.

Sorry status1, I couldn't resist.
It seems that you are still looking for indicator that will do all work for you, and protect you from taking risk...
There is truth in what you said, at the same time I smell deep misunderstanding of what this indicator is. I may be wrong, as often happens.

I don't know what spreadsheet you are talking about but you can use weeklies, no problem, even, you should.
 
That's all well and good but how does this help a trader make a decision whether it's safe enough to place a trade ?
I would imagine it would be difficult for a trader to place a trade based on a certain slope angle
The spreadsheet would be a lot easier if one knows the level at which a trade is safe to place
I am doing it on the SPX weekly so I can't use Scott's spreadsheet so I am just doing it on my own real trading experience
My post was a comment on what I think the "SKEW Driver" is based on and possible alternative methods of deriving the same thing. -- AKA... what the heck is this really measuring... My thinking is more along the lines of "IIF it works, then there may be better or easier ways to create your signal" --

Unclear why you think Scott's algorithm would not be applicable to weeky positions (Shorter terms likely have much different characteristics -- so you may be wise to tread lightly here!) -- You can measure the 30 DTE to get a signal, then use it to trade a different time frame if you think it is worthwhile.

I will think a bit more on how to derive a signal similar to Scotts via an alternate method, to see if it may float. (I don't know if this has value yet)
 
It seems that you are still looking for indicator that will do all work for you, and protect you from taking risk...

That is partially true
I know it's not going to protect me from risk but it will give me a risk reward entry level that I am willing to accept

The spreadsheet I was talking about is the one I made by adapting the 30 day to the weekly and using my own levels of acceptable risk
I am not using this spreadsheet as a skew driver It's more like a trade entry screener
I have been doing pretty much the same thing manually so this makes it a lot easier to go directly to the right spread

It would have been interesting to find out if there is any relationship between the weekly and a certain price but even if there is no such thing I still like the spreadsheet I made and watch how the spread prices move around during trading hours
 
Unclear why you think Scott's algorithm would not be applicable to weeky positions (Shorter terms likely have much different characteristics -- so you may be wise to tread lightly here!) -- You can measure the 30 DTE to get a signal, then use it to trade a different time frame if you think it is worthwhile.

I will think a bit more on how to derive a signal similar to Scotts via an alternate method, to see if it may float. (I don't know if this has value yet)

Well if you think you can find such a signal I and probably many other traders would be interested
I would not even know where to begin to find such a signal
 
thanks to dan for sharing his spreadsheet in tg1.

i suspect everyone who wants to monitor the skewdriver table has already built their own spreadsheet, but
in case you haven't i created one that will allow you to select the expiration date from a date picker and
it will automatically fill in all the data cells. the date picker is supposed to do the update after you click
the date but on my excel version it most times doesn't update. i added an update button to force the
update. since it uses a macro i can't include a link but you can download it from my web site.

www.stockforensics.com/Home/resources/skewdriver.xlsm

i also have a spreadsheet to plot the IV skew for several expiration series. you can capture
a skew line in a separate graph to monitor the skew over time. you can also find that at:

http://www.stockforensics.com/Home/resources/volatility_profile_jun_spx.xls


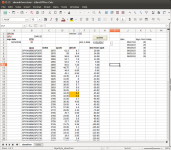
skewdriver screen capture


1946

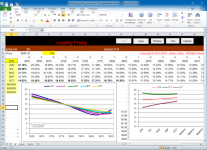
volatility profile screen capture

1947
 
Nicely done,
Unfortunately I am on the road so I just have excel 2003 installed on my laptop so I cannot open the .XLSM file but I will check it out when I get home
I noticed you are using Libreoffice Does that work with RTD ? I thought that only worked with DDE
Is this a newer version of Libreoffice that works with RTD or maybe you are using a workaround ?
 
I noticed you are using Libreoffice Does that work with RTD ? I thought that only worked with DDE
Is this a newer version of Libreoffice that works with RTD or maybe you are using a workaround ?

sorry for the confusion. no, libreoffice doesn't support RTD. i was on my linux system when i posted
this and i was too lazy to log on to my windows computer, so i just loaded the spreadsheet in
libreoffice to get the screen capture.
 
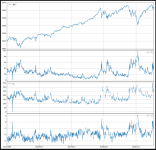
One more graph on this subject. I put together 3 trades side by side on historical data for comparison.

Trade A is, as described by status1 in opening post: vertical put, 30 dte, 20 points wide closest to $5.

Trade B is something similar to Parking Trade. I don't remember details but I used put vertical, 30 dte, 25 pw, closest to $1.
In both cases I plotted distance from ATM (y - axis)

Trade C is BWB: also 30 dte (for consistency), all puts, with fixed long spread equal 50 pw and fixed short spread equal 75 pw. I placed this trade at about 40 points below ATM although this distance can vary as for Trade C I used only 25x strikes.
Here y axis shows price of this trade.

This is quick an dirty plot, code can contain errors, so be aware.
Some gaps you see are due to lack of data. This is noticeable especially with Trade B, which is so far OTM - no efforts were taken to minimize this effect.
Trades B and C were chosen randomly. Note that although dte is the same in all cases results reflects behavior of VolSkew in different places and, with Trade C, using slightly different method.

I leave it to you to verify my results, do additional tests and, eventually, draw the conclusion.


Spreads.png
 
Interesting but I am not sure what the graphs represent
Does this represent the skew of different trades ?
How does this help in selecting a trade ?
It would have been more interesting if the graph showed the p&l of those different trades

Obviously if the vol is higher the trades work out better for the most part depending on where the trade is placed and how it's managed but that could have been also determined by the vix

I was just interested in the relationship between the 20 wide the 30 DTE the $5 price and the distance from ATM as it was
shown in the TG1 skew driver spreadsheet
Is there any conclusion that can be made from that spreadsheet like if it's close to 50 than it's safer to trade or is that just a different gauge like the vix showing when the skew is high or low ?

Just for my own interest I would be curious to see how a weekly shows up on the graph even though it's not an exact comparison
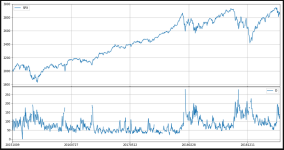
The trade I would be interested is a 7 DTE put vertical 25 points wide closer to 0.65 cents
 
Interesting but I am not sure what the graphs represent
Does this represent the skew of different trades ?
How does this help in selecting a trade ?
It would have been more interesting if the graph showed the p&l of those different trades

Status1, Skew Driver is not a trade, this is indicator. The claim is that if this indicator is low, it predicts market drop, when it is high - that market will rise. To obtain value of SDriver you simply take vertical spread with parameters close to what you spelled out (30dte/20pw/$5) and measure distance of this spread from ATM. This is not a trade per se. I might introduce confusion by using names 'Trade A' 'B' and so on. I should rather speak about 'Setups' or something like that. Because SDriver is not a trade there is no pnl involved. (We can assume that in low SDriver we buy this put vert and in high SDriver we will sell it, but it was never specified this way, beside there is no adjustments, exit points etc.)

My graphs A & B on y-axis have value of indicator constructed by using different setups. I simply went day-by-day, every time (15:30 PM EST) checking how far from ATM our trade/setup is. You can verify value of indicator by eyeballing - see if low values really are followed by market drops (top graph) and vice versa.

On graph C I plotted price of some BWB. Here we have three points, so it is a bit more complicated but idea is the same. Because I used fixed distance from ATM and fixed widths the value that changes is price of this BWB, so on y-axis is price of this BWB. You valuate it the same way as above - by eyeballing.

I was just interested in the relationship between the 20 wide the 30 DTE the $5 price and the distance from ATM as it was
shown in the TG1 skew driver spreadsheet

This is exactly what I've shown on graph A: how this distance changed over time.

Is there any conclusion that can be made from that spreadsheet like if it's close to 50 than it's safer to trade or is that just a different gauge like the vix showing when the skew is high or low ?

I don't want to make any conclusions because this requires longer discussion. But I'd like to address word 'safe' you use so often.
In trading/investing world there is no universal meaning for expression: 'safe trade'. For one trader position with 2% risk is safe, for other having 30% at risk is safe, yet for another holding risk equal 2x his net worth can also be perceived as safe. One trader can see potential loss of 10K and still say this is save trade because he trusts in his skills, while for other, with lesser skills, the same trade will be very risky.
Sometimes traders do use word 'safe' to indicate that they see probabilities and risk/reward to be in their favor (this is not objective!), often it is used by 'dream sellers' to lure pray.
If you want to be safe from loosing money on the market - don't be on the market.

Just for my own interest I would be curious to see how a weekly shows up on the graph even though it's not an exact comparison
The trade I would be interested is a 7 DTE put vertical 25 points wide closer to 0.65 cents


Here you go. All the same as in A & B just with different setup.

Spread65.png
 
Thanks for the explanation
I understand that this is not a trade but an indicator but I don't see how this can "predict" that the market will go high or low I understand that this is just a claim but the way I see it if the indicator is low the vix is low and it can stay low for a long time like in 2017 and when the indicator is high the vix is high and it can always go higher but it's more limited on the high side

I understand your explanation about the word safe and I did not mean it in the strict sense
I meant it in a sense of a trade that is favorable from the risk reward standpoint
What I was trying to determine is how is this supposed to be used or how is Scott using this to determine when to place a trade
 
Jim,
I am finally home and I was able to download and open that xlsx spreadsheet you provided
The spreadsheet itself is working and it is similar to the one I made
That update button is not working though
It gives a compiler error when I click on it and saying"Method or data member not found"
Also I assume there supposed to be a drop down next to pick a date but nothing happens when I click on that so I am not sure if the 2 problems are related
It's not a big deal as I can change the date manually I just thought I mention any issues with it
Kevin Lee had a video on CD where he showed how to make a drop down for the date and use it with excel without any vba so I could set that up if I want it but I am not using this spreadsheet that often so it's not that important
 
yes, when you click on the arrow next to the date picker a calendar should drop down. the most likely cause
of these problems is that you don't have macros enabled. i have the 2010 excel version so your procedure
for enabling them may be different. in excel 2010 there is a trust center option after you click file... options.
when the trust center window opens, there's a trust center settings button. after clicking that you can set the
macro settings. it's safe to disable macros with notification. this will notify you that macros are disable and
give you the option of enabling them for this spreadsheet. it will then become a trusted document and you won't
see the notice anymore. you can clear the trusted documents via the trusted documents settings at a later time
if you choose.
 
Top
Contact Us